Trends can be classified as primary, intermediate and short term. However, markets exist in several time frames simultaneously.
As such, there can be conflicting trends within a particular stock depending on the time frame being considered.
It is not out of the ordinary for a stock to be in a primary uptrend while being mired in intermediate and short-term downtrends.
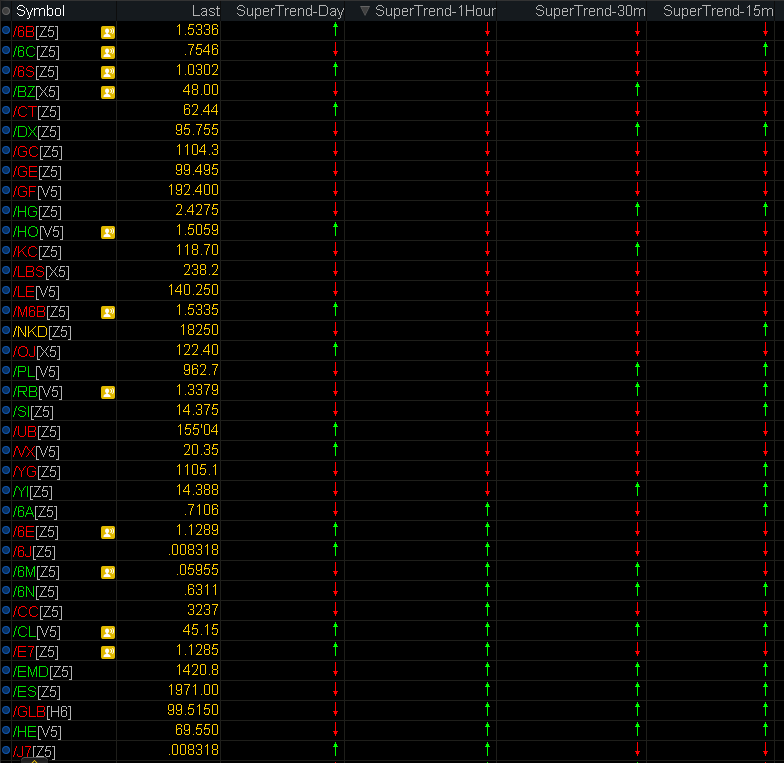
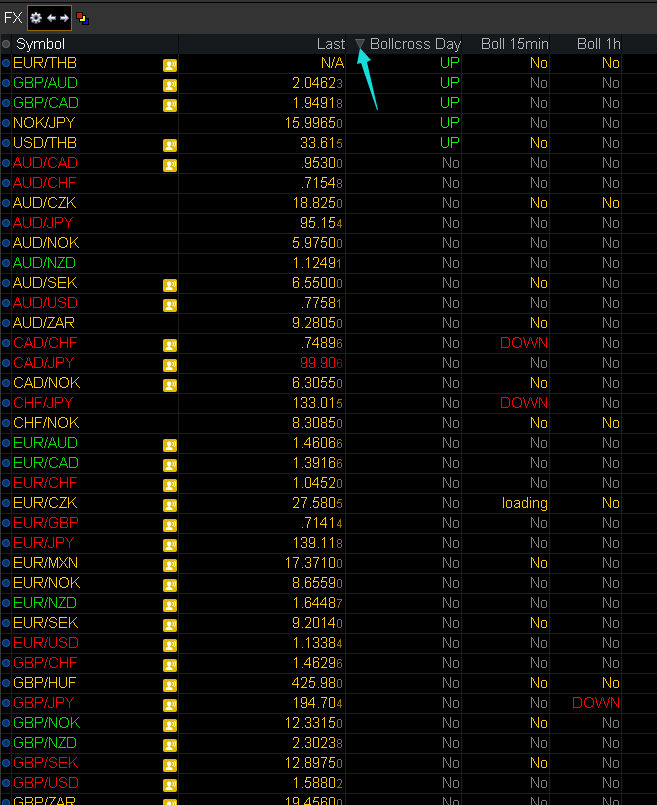
It's very important to keep track of all trends, and using a screener is the only way to do it.

The pictures only show 3 different timeframes.
But you can have all of the following timeframes listed on the screen at the same time.
All time frames:
MIN
TWO_MIN
THREE_MIN
FOUR_MIN
FIVE_MIN
TEN_MIN
FIFTEEN_MIN
TWENTY_MIN
THIRTY_MIN
HOUR
TWO_HOURS
FOUR_HOURS
DAY
TWO_DAYS
THREE_DAYS
FOUR_DAYS
WEEK
MONTH
OPT_EXP