
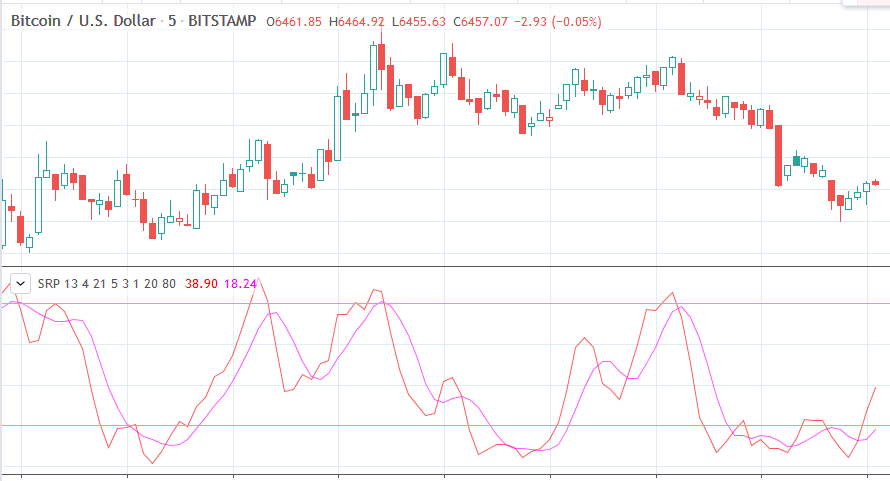
The Stochastic RSI technical indicator applies Stochastic Oscillator to values of the Relative Strength Index ( RSI ). The indicator thus produces two main plots FullK and FullD oscillating between oversold and overbought levels. This combination of indicators produces signals that tend to be more precise than those given by the RSI .
The interpretation of the indicator is similar to the original RSI's: valuable signals are often produced at crossovers of the main plot with overbought and oversold levels. However, the default values of these levels are slightly different: in the stochastic version, these are at 80 and 20, respectively. Actual indication of the crossovers can be enabled by adjusting the show breakout signals parameter value.
The PRO version has the more than one average type on both RSI and Stochastic .
RSI average type : simple, exponential, weighted, Wilder's, or Hull.
Stochastic average type: simple, exponential, weighted, Wilder's, or Hull.
No comments:
Post a Comment