
Unlike our regular divergence indicators, this divergence detector is able to check divergence from any input indicator's plot.
Please note that the indicator must have a plot which has value on every bar, otherwise it cannot be used by the divergence detector.
Purchase link:Divergence detector from any input indicator's plot on NinjaTrader 8.
It has the following features and inputs:
- Instant signal on current (last) bar, no repaint.
- Choose 4 different colors for 4 types of divergence signal and line.
- Alert when a signal appears.
- Select different sound alert files.
- Enable to show lines between Highs and Lows.
- Please note: it doesn't work in Renko chart.
- Market Analyzer with alert. You can add new sound files to your NT8\sounds directory.
- Wait 1 bar: enable this new feature will display the signal 1 bar later in order to check the trend direction of both price and related indicator, otherwise, it will display the signal on current bar. We consider this feature as a 1 bar confirmation for divergence signals.
There are two plots (bullish signal and bearish signal) that can be used from other Ninjatrader functions, such as Market Analyzer and strategy builder.
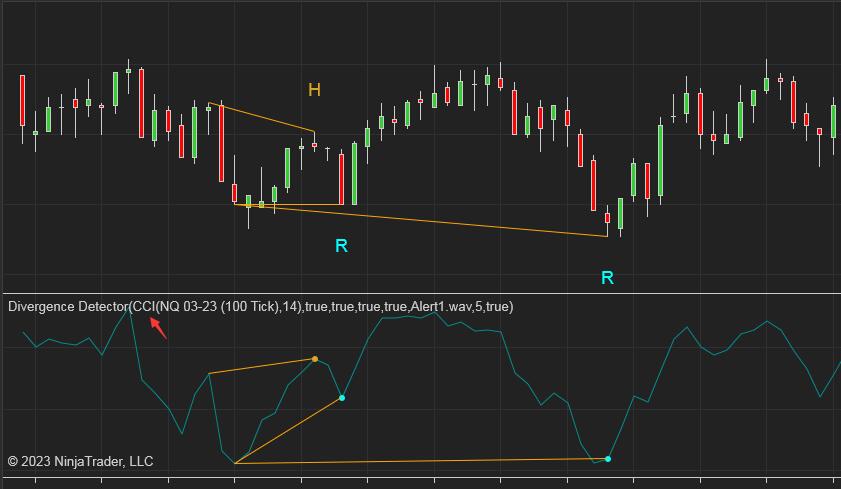
A hidden divergence is where price has a higher Low, but the indicator has a relative lower value.
Or if price has a lower High, but the indicator has a relative higher value.
There will be a 'H' drawn under a hidden divergence.
A 'R' drawn under a regular divergence.


Here is how it works, after adding the Divergence detector, we need to add the indicator's plot that we want to check divergence from the Data Series as image below.

For example, if we want to use MACD to check divergence, then we need to find MACD from the Input series as image below, and choose the Plot MACD. We can also use the Diff plot of the MACD.

It will plot as chart below, please note that it will only plot the selected Plot of the indicator, since we choose MACD, it will only show the line of MACD, but not the AVG and Diff on sub chart.

If we chose Diff plot of MACD.

If you want to use different plot style such as bar instead of line for the Diff plot of MACD, you need to change it from here:

The Divergence detector will plot as chart below based on the MACD diff plot.


No comments:
Post a Comment