Thursday, May 28, 2026

Case Study: Capturing Short-Term Resistance in a Strong Uptrend with DynamicSupplyDemandZone


Case Study: Capturing Short-Term Resistance in a Strong Uptrend with DynamicSupplyDemandZone


In this example, the market is moving within a clear upward trend. Price continues to form higher highs and higher lows, while demand zones repeatedly act as support during pullbacks. Under this type of market condition, traders often need to identify short-term resistance quickly, because countertrend supply areas may appear briefly before price either reacts or continues higher.
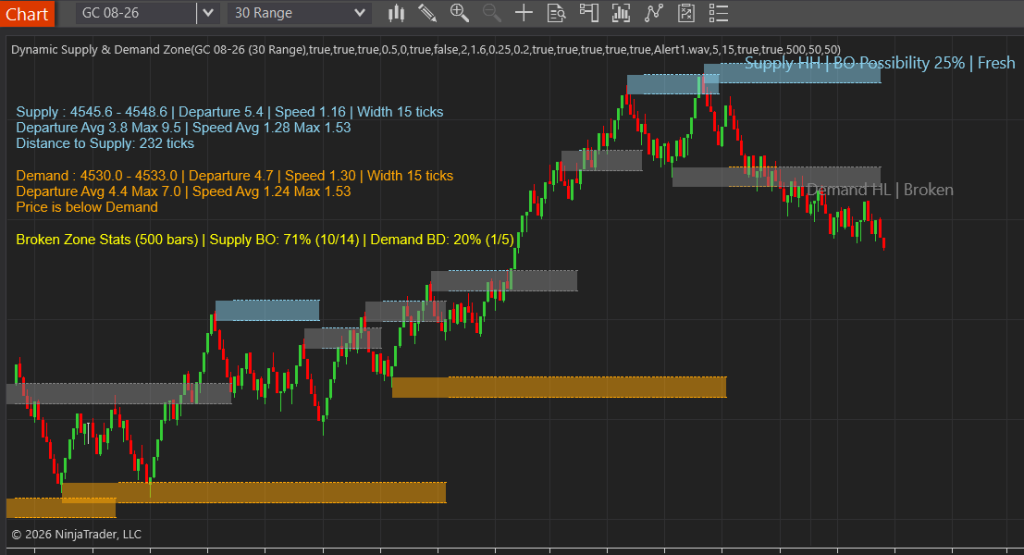


Using DynamicSupplyDemandZone, the indicator settings can be adjusted to better match this environment.

For a strong uptrend, a smaller value can be used for Strength for Supply. This makes the indicator more sensitive when detecting potential supply zones. As a result, short-term resistance areas can be identified earlier, even if the supply structure is relatively small or temporary.

At the same time, a relatively larger value can be used for Strength for Demand. This helps filter out weaker demand areas and focuses more attention on stronger support zones that are more relevant within the dominant bullish trend.

In the chart, the market advances strongly before forming several short-term supply zones near the upper price area. These supply zones provide traders with a faster visual reference for possible intraday resistance. Instead of waiting for a larger reversal structure to develop, traders can use these zones to monitor where price may pause, reject, or pull back.

The demand zones below price remain important because they represent areas where buyers previously stepped in. With a higher demand strength setting, the indicator highlights more meaningful support zones rather than every minor pullback. This creates a cleaner chart and helps traders stay aligned with the broader uptrend.

This approach is especially useful for short-term traders who want to:

Identify potential resistance earlier during a strong rally.

Avoid overreacting to weak demand zones in an uptrend.

Use supply zones as reference areas for profit-taking, pullback monitoring, or trade management.

Maintain focus on the dominant bullish structure while still tracking short-term selling pressure.

Overall, this case shows how DynamicSupplyDemandZone can be adapted to different market conditions. In a clearly rising market, using a lower Strength for Supply and a higher Strength for Demand allows traders to detect short-term resistance more quickly while keeping the main support structure cleaner and more reliable.

Sunday, January 11, 2026

Mastering Market Discrepancies: A Comprehensive Guide to the Divergence Detector Indicator

The Divergence Detector by PatternSmart is a highly versatile technical analysis tool designed for NinjaTrader 8. Unlike standard divergence indicators that are locked to a single oscillator (like RSI or MACD), this tool can detect price-momentum discrepancies from any valid indicator plot.

  Get this indicator now:Divergence detector from any input indicator's plot on NinjaTrader 8.


What is the Divergence Detector?

In technical analysis, divergence occurs when the price of an asset moves in the opposite direction of a technical indicator. This conflict suggests that the current price trend is losing momentum and may soon reverse or stall.


The PatternSmart Divergence Detector automates this complex visual task. It scans for both Regular and Hidden divergences across four distinct types, marking them instantly on your chart to remove subjective guesswork.

Key Features and Functionality

  • Universal Compatibility: You can link the detector to any sub-chart indicator (RSI, MACD, CCI, etc.). It works by selecting a specific plot (e.g., the MACD line or the Histogram) as the input source.

  • No Repainting: Signals are drawn instantly on the current bar.


  • 1-Bar Confirmation: A "Wait 1 bar" feature allows you to display signals one bar later to ensure the trend direction of both price and the indicator is confirmed.


  • Visual Distinction: It labels signals clearly—"R" for Regular (reversal) and "H" for Hidden (continuation)—with customizable colors for bullish and bearish lines.

  • Multi-Range Scanning: You can toggle between short, mid, and long bar ranges to find divergences that fit your specific timeframe or trading style.


How to Use the Divergence Detector

To get the most out of the indicator, follow these three steps for effective technical analysis:

1. Identify the Market Context

Before looking at signals, determine if the market is trending or range-bound.

  • Regular Divergence (Reversal): Look for these at the end of extended trends. A Regular Bullish signal appears when price makes a lower low, but your indicator makes a higher low.


  • Hidden Divergence (Continuation): Look for these during pullbacks within a strong trend. A Hidden Bullish signal appears when price makes a higher low, but the indicator makes a lower low.


2. Confirm with the "Wait 1 Bar" Feature

To avoid "fakeouts," enable the Wait 1 bar setting. This ensures the pivot point is fully formed before a signal is plotted, providing a more reliable foundation for a trade entry.


3. Use in Confluence

Divergence is a powerful "leading" signal, but it shouldn't be used in isolation.


  • Volume: If a bullish divergence appears, check if volume is increasing on the up-bars to confirm buyer interest.

  • Support & Resistance: A regular divergence carries significantly more weight if it occurs at a major historical support or resistance level.

Why It’s Useful for Technical Analysis

The primary value of this indicator is efficiency and objectivity. Spotting divergences manually is tedious and prone to human error—especially hidden divergences, which are often overlooked. By using an automated detector, you ensure that every potential momentum shift is brought to your attention instantly. Additionally, because it can be used with any indicator, you can tailor it to the specific momentum tool that historically works best for the asset you are trading (e.g., using MACD for Forex or RSI for Stocks).

 Get this indicator now:Divergence detector from any input indicator's plot on NinjaTrader 8.