Introduction
This article presents a detailed technical analysis of the E-mini S&P 500 futures contract (ES 03-26), using a 5-minute execution chart overlaid with a Multi-Time-Frame (MTF) SuperTrend indicator in NinjaTrader 8. The analysis focuses on a sharp bearish reversal and demonstrates how projecting higher-timeframe SuperTrend signals (15-minute, 30-minute, and 60-minute) onto a lower-timeframe chart provides critical context, improves trend confirmation, and helps filter market noise.
The examined chart offers a textbook example of multi-time-frame trend alignment, showing how short-, intermediate-, and higher-timeframe SuperTrend signals transition during a market breakdown and subsequently guide high-probability pullback entries in the direction of the dominant trend.

The MTF SuperTrend Indicator: Concept and ConstructionThe SuperTrend indicator is a volatility-based, trend-following overlay derived from the Average True Range (ATR). It dynamically plots a trailing support or resistance line that adapts to market volatility.
Core Mechanics
-
Midline: (High + Low) / 2
-
Upper Band: Midline + (ATR × Multiplier)
-
Lower Band: Midline − (ATR × Multiplier)
The indicator plots a single line:
-
Bullish trend: Line plotted below price (commonly green).
-
Bearish trend: Line plotted above price (commonly red).
-
A trend reversal is confirmed when price closes on the opposite side of the line.
Multi-Time-Frame Enhancement
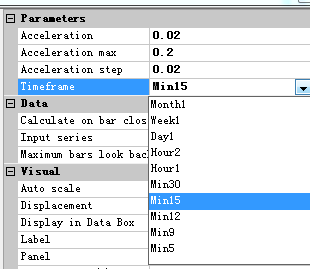
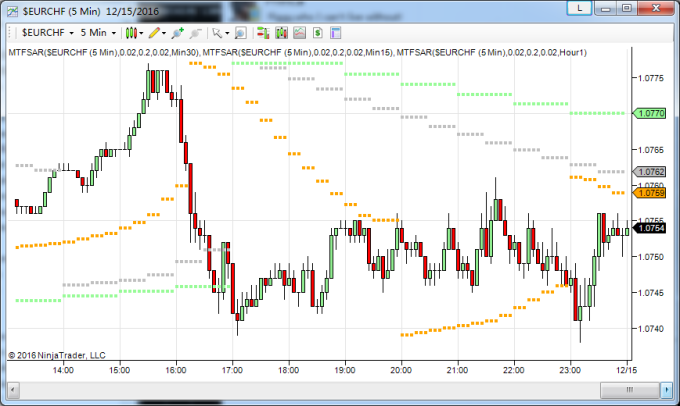
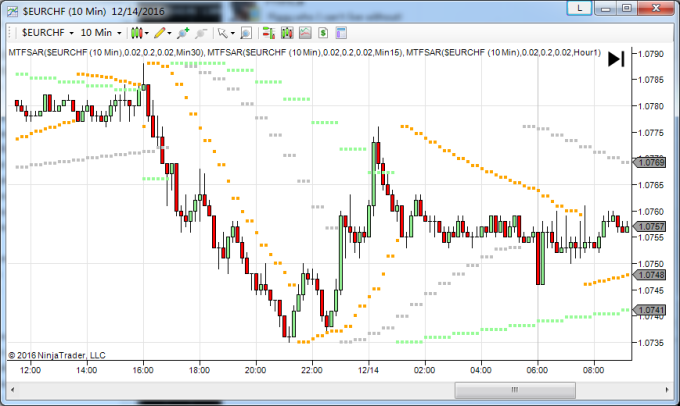
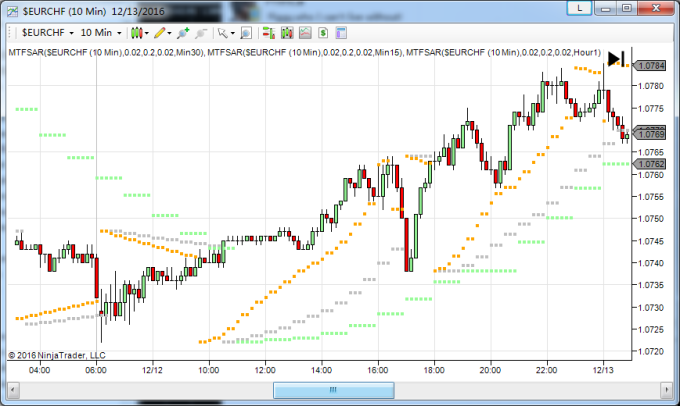
The MTF SuperTrend extends this concept by calculating SuperTrend values from higher timeframes and rendering them directly on the lower-timeframe chart. In this case:
-
15-minute: Short-term higher-timeframe context.
-
30-minute: Intermediate trend filter.
-
60-minute: Primary trend authority.
This structure allows traders to maintain execution precision on a 5-minute chart while remaining aligned with higher-timeframe momentum.
Role of Each Timeframe
| Timeframe | Role | Characteristics |
|---|---|---|
| 15-Minute | Early trend change detection, short-term confirmation | Most sensitive, flips fastest |
| 30-Minute | Intermediate trend filter and dynamic stop | Balanced sensitivity |
| 60-Minute | Primary trend direction (“big picture”) | Most stable, widest stop |
The core operating principle is trend alignment: trades should be taken only in the direction of the dominant higher-timeframe trend.
Market Structure and Price Action Overview
The chart shows ES price action transitioning from consolidation near the 6920–6935 area into a sharp bearish breakdown, ultimately reaching the 6670s. Candle structure expands significantly on the downside, implying increased volatility and strong selling pressure.
The move unfolds in three distinct phases:
-
Pre-breakdown consolidation
-
Impulse breakdown and trend flip
-
Post-breakdown consolidation and pullback
Each phase reveals how the MTF SuperTrend behaves across timeframes.
Phase 1: Pre-Breakdown Consolidation
During the initial phase, price trades sideways with a slight bullish bias around 6920–6935.
-
All three SuperTrend lines (15-, 30-, and 60-minute) are bullish and clustered beneath price.
-
The market exhibits compression rather than directional conviction.
-
Higher-timeframe bias remains bullish, but momentum is weakening.
This environment favors patience rather than aggressive positioning.
Phase 2: Breakdown and Bearish Trend Confirmation
The decisive event is a sharp downside impulse that breaks price below all SuperTrend levels.
15-Minute SuperTrend
-
Flips bearish first.
-
Provides the earliest warning of momentum shift.
-
Suitable for aggressive exits from longs or early short entries.
30-Minute SuperTrend
-
Flips bearish shortly after.
-
Confirms the move has intermediate-timeframe validity.
-
Establishes a reliable dynamic resistance level.
60-Minute SuperTrend
-
Flips last, after the downtrend is clearly underway.
-
Confirms a higher-timeframe trend reversal.
-
Once bearish, it becomes the primary directional filter.
At this point, all three timeframes align bearish, significantly increasing the probability that the move is not a false breakdown.
Phase 3: Post-Breakdown Consolidation and Pullback
After the initial sell-off, price enters a corrective phase, consolidating and attempting a minor retracement toward the 6880–6890 area.
This phase highlights the importance of multi-time-frame context:
-
15-Minute SuperTrend briefly flips bullish, signaling a counter-trend bounce.
-
30-Minute and 60-Minute SuperTrends remain firmly bearish.
Rather than signaling a trend reversal, this configuration defines a classic pullback entry zone:
-
The 30-minute SuperTrend acts as dynamic resistance.
-
Price tests this level from below and fails.
-
The higher-timeframe bearish bias remains intact.
This is a high-probability short setup that would be missed—or misinterpreted—if using only a single timeframe.
Trading Strategy Synthesis
1. Primary Trend Filter
-
Trade exclusively in the direction of the 60-minute SuperTrend.
-
Once the 60-minute flips bearish, maintain a short-only bias.
2. Entry Logic
-
Use the 30-minute SuperTrend as the entry confirmation level.
-
Ideal shorts occur on pullbacks into the 30-minute line while the 60-minute remains bearish.
-
The 15-minute SuperTrend can assist with timing but should not override higher-timeframe bias.
3. Stop-Loss and Trade Management
-
Place stops just beyond the 30-minute SuperTrend line.
-
Trail stops dynamically as the line descends.
-
Use the 15-minute SuperTrend for partial exits or fine-tuning final exits.
4. Risk Considerations
-
Avoid trading during transition phases when higher-timeframe signals are mixed.
-
Be mindful of volatility expansion following large impulse moves.
-
Complement the setup with market context (e.g., key levels, volume, or session timing).
Advantages of the MTF SuperTrend Approach
-
Maintains higher-timeframe awareness without switching charts.
-
Filters false signals common on lower timeframes.
-
Provides objective, rule-based trend confirmation.
-
Serves simultaneously as trend filter, entry guide, and dynamic stop.
This makes it particularly effective in strong directional markets such as index futures during institutional flows or macro-driven sessions.
Conclusion
The ES 03-26 breakdown analyzed here demonstrates the strength of multi-time-frame confluence when using the MTF SuperTrend indicator in NinjaTrader 8. The sequential alignment of bearish signals across 15-, 30-, and 60-minute timeframes confirms a high-quality trend reversal, while post-breakdown pullbacks offer structured, low-risk short opportunities.
By anchoring decisions to the dominant higher-timeframe trend and executing with precision on a lower timeframe, traders can significantly improve consistency, reduce whipsaws, and maintain disciplined risk control. The MTF SuperTrend is not merely an indicator, but a complete framework for trend-aligned futures trading.
You can order this indicator from: Multi Time Frame (MTF) Super Trend indicator for NinjaTrader 8