Showing posts with label cci Divergence indicator. Show all posts

Tuesday, January 29, 2019

CCI DOUBLE DIVERGENCE indicator and scanner for Multicharts


Divergence indicator is a very common and useful tool in technical analysis. It indicates possible reversal signals when there are discrepancies between an indicator and price movement. For more details of the general definition of divergence indicator please check this link:  https://goo.gl/GTJy17


What is CCI Double Divergence?


The concept of Double divergence is straightforward. It is triggered when there are two continuous divergences in a row between current High and previous Peak. Comparing to normal divergence indicator, the double divergence indicator gives confirmations two at a time, which is more reassuring and revealing.

For example, the chart below shows regular bearish CCI Double divergence and regular bullish CCI Double divergence.


Features and inputs:


This indicator will draw the following at the end of a bar (when a bar is closed):

  1.     a letter R above a bar if there is a Regular bearish divergence occurred.
  2.     a letter H above a bar if there is a Hidden bearish divergence occurred.
  3.     a letter R below a bar if there is a Regular bullish divergence occurred.
  4.     a letter H below a bar if there is a Hidden bullish divergence occurred.
  5.     two lines from signal bar's High to previous peaks if there is a Regular bearish divergence occurred.
  6.     two lines from signal bar's Low to previous troughs if there is a Regular bullish divergence occurred.
  7.     two lines from signal bar's CCI value to previous peaks or troughs CCI values.
  8.     Instant signal right after on current bar close, no repaint.
  9.     Alert when a signal appear.
  10.     Select different sound alert files.
  11.     Enable to show divergence trend lines.
  12.     Control the CCI inputs at the same time.


    Please use the following available colors for divergence line color: Black  Blue  Cyan  DarkBlue  DarkBrown  DarkCyan  DarkGray  DarkGreen   DarkMagenta  DarkRed  DarkYellow  Green  LightGray  Magenta  Red  White  Yellow

    Please note: it only works on regular and Heikin-Ashi chart.


This package also comes with a scanner, it will display when the last DOUBLE DIVERGENCE occurred. 


Please make sure you select  "CCI Double Divergence Scanner" in Scanner, not "CCI Double Divergence".


It has less input than the DOUBLE DIVERGENCE indicator.

    ShowHidden, if set to true it will scan both hidden and regular DOUBLE DIVERGENCE.
    if set to false it will only scan regular DOUBLE DIVERGENCE.

    Range, is the number of bars to check the existence of DOUBLE DIVERGENCE.
    
    If set it to 20 it will only check if there was a DOUBLE DIVERGENCE within the last 20 bars.
    
    If set it to 10 it will only check if there was a DOUBLE DIVERGENCE within the last 10 bars.


For example, as the selected row in the image below, there's a CCI bullish hidden double divergence detected at 1 bar ago of GBPJPY 5 minutes chart.


Please make sure you use the same inputs for both indicator and scanner.


Click the image to view in full size.


Tuesday, June 23, 2015

CCI Divergence indicator for Thinkorswim TOS


Commodity Channel Index (CCI) is an oscillator which can help traders to identify over-sold and over-bought level.

CCI Divergence indicator gives possible reversal signals when there are discrepancies between CCI and price movement.
Divergence emerges when price and oscillator indicator move in different directions.

For instance, an uptrend Negative Divergence occurs when price reaches a higher high, but the indicator fails to follow. In a downtrend, positive divergence occurs when price reaches a lower low, yet the indicator does not reach a lower low.
For the most part, oscillator indicators and price trailing each other and move in the same direction. However, when they start to drift apart, the current trade may consolidate or exhibit a reverse pattern. 
Features:
  1. Alert: provide both sound and message alert whenever a divergence is found. You can turn it on or off.
     
  2. Length 1&2: Define the range of bars which are used to calculate the recent High and previous High, as shown in picture.
     
  3. CCI_mode: Choose "Upper" to only plot signal arrows on price chart.
    Choose "lower" it will plot as a CCI indicator with divergence signals.

     
  4. Percent: The difference between High1 and High2, as shown in picture. 
     
  5. CCI_Percent: The difference between CCI1 and CCI2, as shown in picture. 
     
  6. All Parameters of CCI: Adjust the inputs of CCI indicator.


How to use:
The purpose of divergence indicator is to point when price  trend are moving into  opposite direction.
Negative divergence:
First of all, we need to locate the recent High1 and its CCI1 value within the given range(lenght1).
Secondly, we find the previous High2 and its CCI2 value within the given range(lenght2).

Then we compare the ratio of these 2 Highs and CCI values to determine if they meet the percentage you set.

For example, if you set "percent=3", then it will check if High1 is greater than High2 by 3%. If you set "CCI percent=5" then it will check if CCI1 is less than CCI2 by 5%.
If both percent conditions are met, there will be a red arrow pointing downward.

Positive divergence:
The indicator will find the recent Low1 and its CCI1 value within the given range(lenght1).
And then it will find the previous Low2 and its CCI2 value within the given range(lenght2).

If you set "percent=1", then it will check if Low1 is less than Low2 by 1%. If you set "CCI percent=5" then it will check if CCI1 is greater than CCI2 by 5%.
If both percent conditions are met, there will be a green arrow pointing upward.


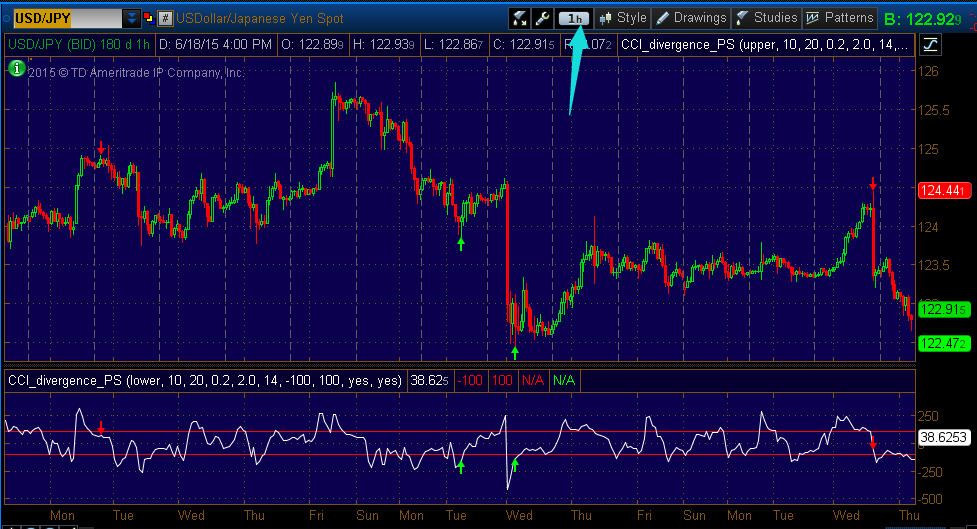
Please note: in order to plot this indicator on both price chart and lower chart, you need to load it in two places. And set CCI_mode to "Upper" in Price chart and CCI_mode to "lower" in Lower chart. As shown in the following picture.

If you want the same signals on both charts, all parameters have to be consistent on both sides.


This indicator works in any time period and applicable for all securities(Stocks, Futures, Forex, Options,ETF, etc.).
When you use this indicator in minute chart, it's better to set "percent" less than 1, otherwise, lots of signals will be filtered.

If you want to add any feature to this indicator, please send us a Customization request.