
Unlike other trading platforms, we have to create a MTF version of an indicator separately, in Sierra Chart, we can use almost any indicator as multi timeframe.
The following are the basic steps to accomplish this:
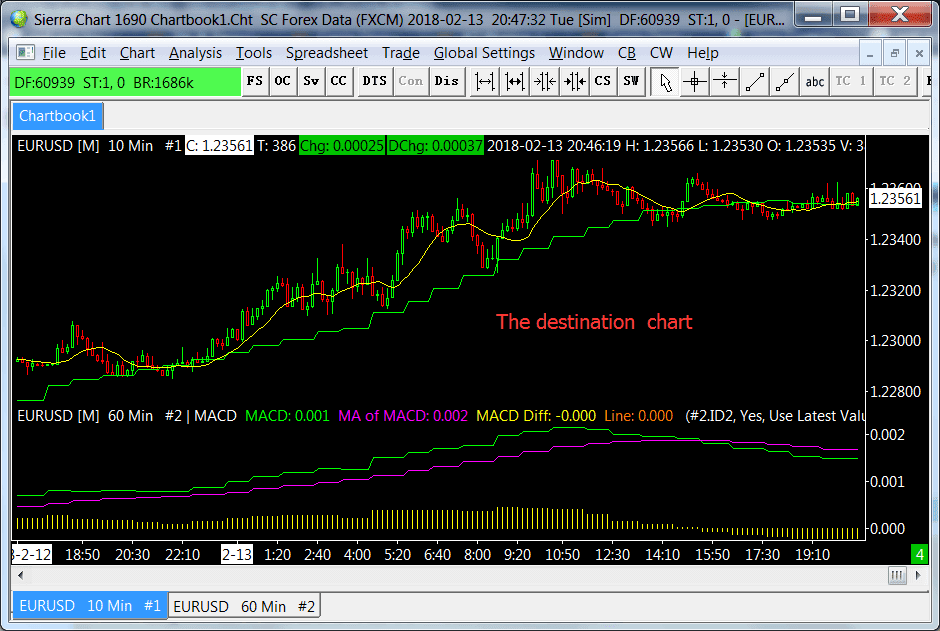
First, you need to open the main chart or the destination chart(as shown in below) which you want to add a MTF indicator to it.
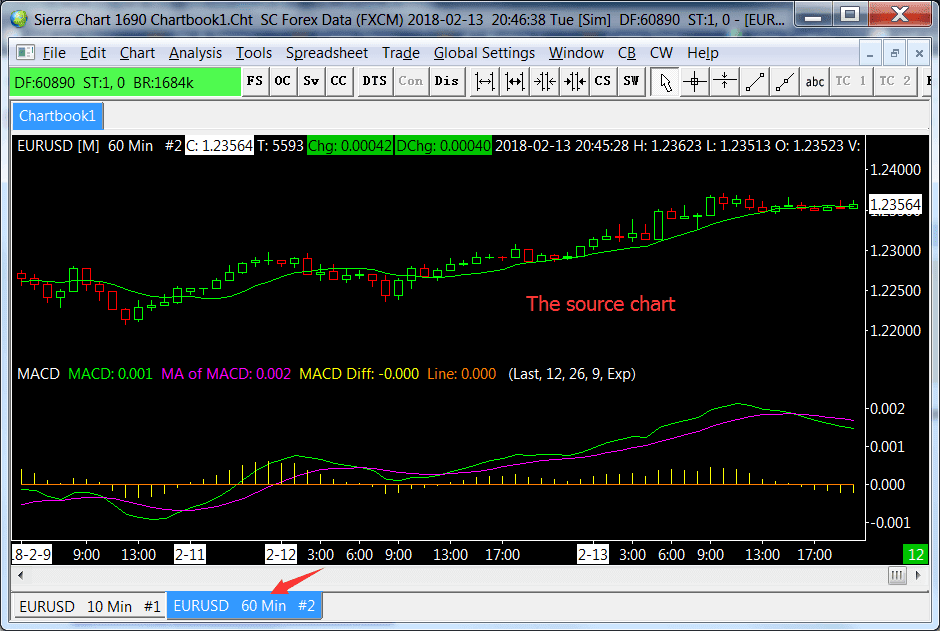
Second, you need to open another chart (the source chart) with a higher timeframe. If you want to use a MTF SMA and a MTF MACD on the , then add SMA and MACD to the source chart, as shown in below.
Then you can use the Study/Price Overlay study to add the indicator from a higher timeframe(source chart) to the main chart( destination chart), in this case, a MTF SMA and MACD.
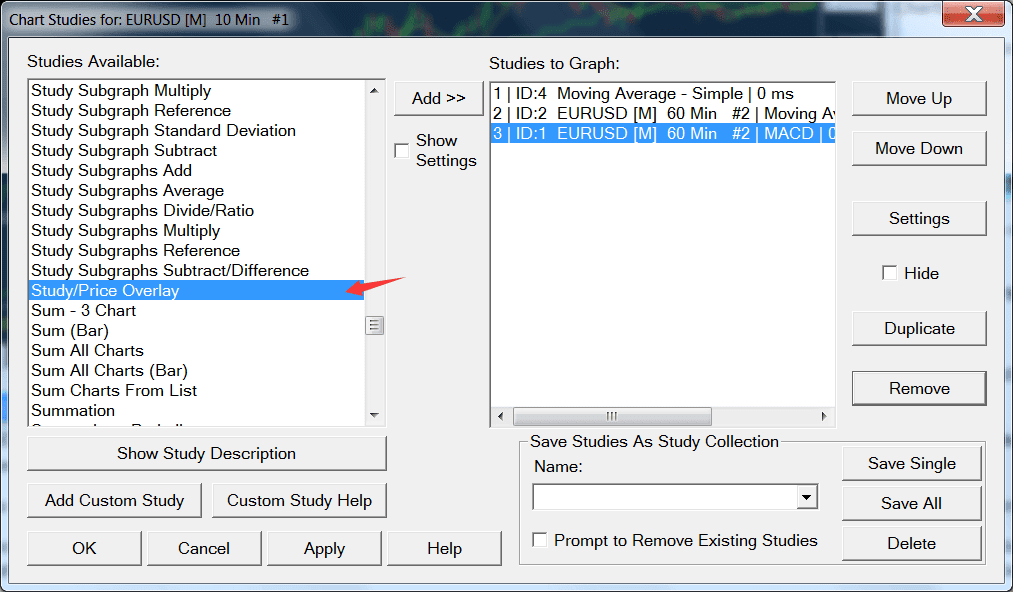
What you need to do is adding two Study/Price Overlay study to the main chart as shown in below.
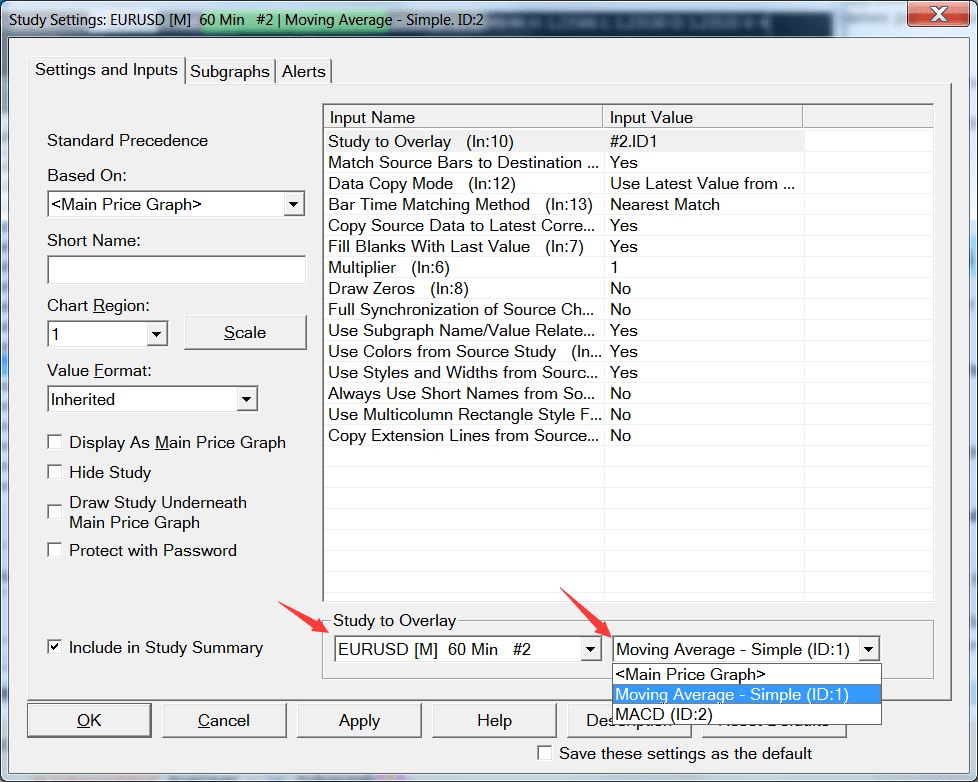
In the setting page of the Study/Price Overlay study, choose the source chart from the "study to Overlay" menu and select the indicator on the right side.
The above example shows how to add two indicators as MTF, if you only need one MTF indicator then you only need to add Study/Price Overlay study to main chart.
Please note that you don't add the Study/Price Overlay study on the destination chart.
Use the Study/Price Overlay study on the destination chart to reference the source chart data. Once you get the study configured as you require, then the data can be referenced from that study as explained below. If you cannot accomplish what you want with the overlay study, then what you require is not supported.
You can also check Sierra Chart's official docs: How to Overlay a Study or Main Price Graph From One Chart Onto Another Chart with a Different Timeframe per Bar or Symbol (Study/Price Overlay Study)
No comments:
Post a Comment