Showing posts with label Sierra Chart. Show all posts

Monday, April 1, 2019

Trend Pullback Reversal TPR indicator for Sierra Chart


The TPR(Trend Pullback Reversal) indicator forms a possible price trend line and the trend line can be used as support & resistance level, it also provides Pullback and Reversal signals.

TPR works on all timeframes and all symbols and all type of bar chart.
TPR never repaints.
There are 4 Parameters:
  1. Period: number of bars used for calculations
  2. Factor: Multiplier factor, small number for short trend, large number for long trend
  3. ShowSignal: enable to show the signal dots
  4. ShowBand: enable to show band and center line


Click an image to view at full size.


We use the same algorithm for the TPR on all platforms, it will work exactly the same on any platform, you can also view some screenshot and videos we took from other platforms.

This is a video of how TPR indicator on NT8 performs in a relatively long-term downtrend of Forex AUDUSD 5min chart.


IFrame


You may think it looks like supertrend or braintrend, right?

Actually, most trend indicators have similar plot, the differences are where and when they give signals.
Unlike other trend indicators, TPR will focus on main trend and filter out most minor price movements. The green cross-line represents an uptrend, the red cross-line represents a downtrend and the blue dots are signals for possible reversals.
The additional band and center line may look like bollinger band, but the TPR band algorithm is completely different from bollingerband. There is no standard deviation in TPR band calculation.

The following image is a comparision of TPR and BOLL.


The TPR band gives a possible range of the TPR movement, if TPR is outside of the band for many bars or far away from the band, it could be a sign of trend reversal.
The chart below is an example of TPR outside of band.


You can see how TPR reacts to price movement from the following images.
The orange and cyan dots give possible reversal signals.


If you are familiar with Supertrend indicator, you may think the TPR is almost the same as Supertrend. In this case, you should read the following content.
If only check the line plot from both Supertrend and TPR, it's easier to notice that TPR may change trend ealier than supertrend, as shown in the charts below, but that's not the main difference between them.


The most important difference bewteen TPR and supertrend is that TPR can be used as support and resistance indicator as well, not just a trend indicator.
The following 2 charts have both TPR and supertrend. The solid line is from supertrend, the cross line is TPR.


As you can see, the line from TPR provides a very good support and resistance level, but supertrend is far away from the price bar which cannot be used as support and resistance level at all.


In short, if you only need a trend indicator, both TPR and Supertrend will do the job.
But if you also want it to provide support and resistance level, TPR is much better than supertrend.


For more screenshots please visit:  https://t.co/JQacXoMsNG


Friday, April 27, 2018

True Center Band (TCB) indicator for Sierra Chart


You might wonder, is there an indicator can show the trend, different levels of support and resistance, and the boundary of price action? The answer is yes, True Center Band (TCB) indicator is capable of doing all of them.


It consists of one center line to measure the center of price range within a given period,
and three channels (bands) represent different support and resistance levels.


True Center Band may look like some other indicators, such as Center of Gravity (COG) and polynomial Regression Channel (PRC). But there is one major difference, TCB never repaints, because it is not calculated by future data. Reliability makes TCB looks good, works better.


True Center Band is specially designed to work on all intraday charts (tick, mins, renko, range, etc.) and daily chart. It also works on all markets (Stocks, Futures, Forex, Options,ETF, etc.)


A good indicator should make complicated things simple.
Therefore, there is only 1 parameter.

Period: the number of bars used to calculate the True Center Band (TCB).

It's very easy to understand, if you want TCB to plot a long-term trend then set a big number such as 50.

If you want to see a short-term trend, then set a small number such as 15.


True Center Band will automatically plot the support and resistance levels based on the total number of bars loaded on chart. 

For example, if we load 2 days for a 1-min chart, TCB will plot like the image below.


For the same symbol, same date and time range and timeframe, if we load 10 days TCB will plot like the image below. The bands become much wider than the chart above, that's because the price range in the past 10 days is wider than the past 2 days.


For Minute chart of more than 30mins, in order to see a longer range of support and resistance levels, it's better to load more days in "Chart Settings".

If we load 50 days for a 30-min chart, the support and resistance lines will be calculated by the data from last 50 days.


If you want to see the recent range of support and resistance levels, then just load the number of days you desire.


Tuesday, February 13, 2018

How to use indicator/study as multi timeframe MTF in Sierra Chart


Unlike other trading platforms, we have to create a MTF version of an indicator separately, in Sierra Chart, we can use almost any indicator as multi timeframe.
 

The following are the basic steps to accomplish this:


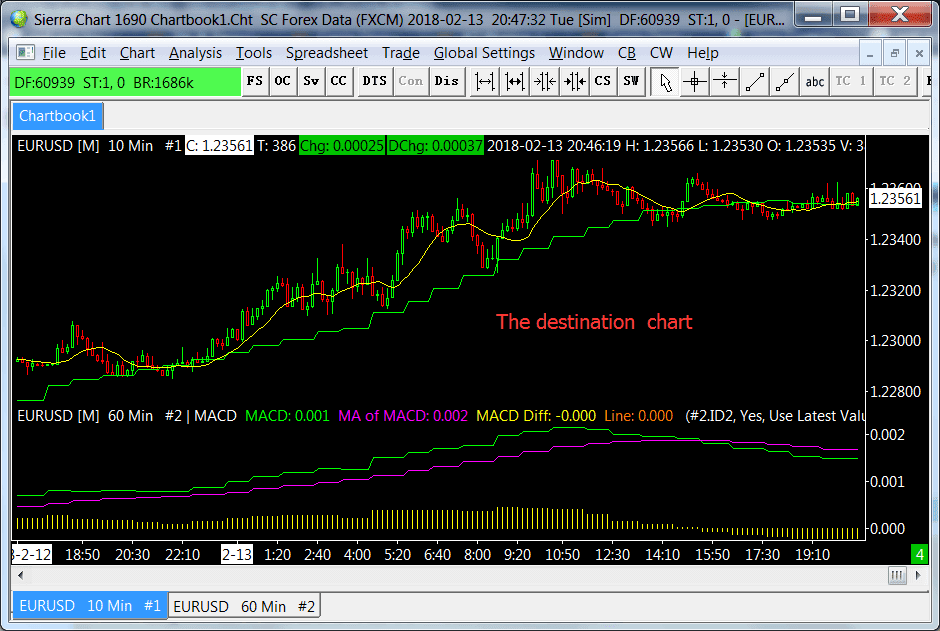
First, you need to open the main chart or the destination chart(as shown in below) which you want to add a MTF indicator to it. 


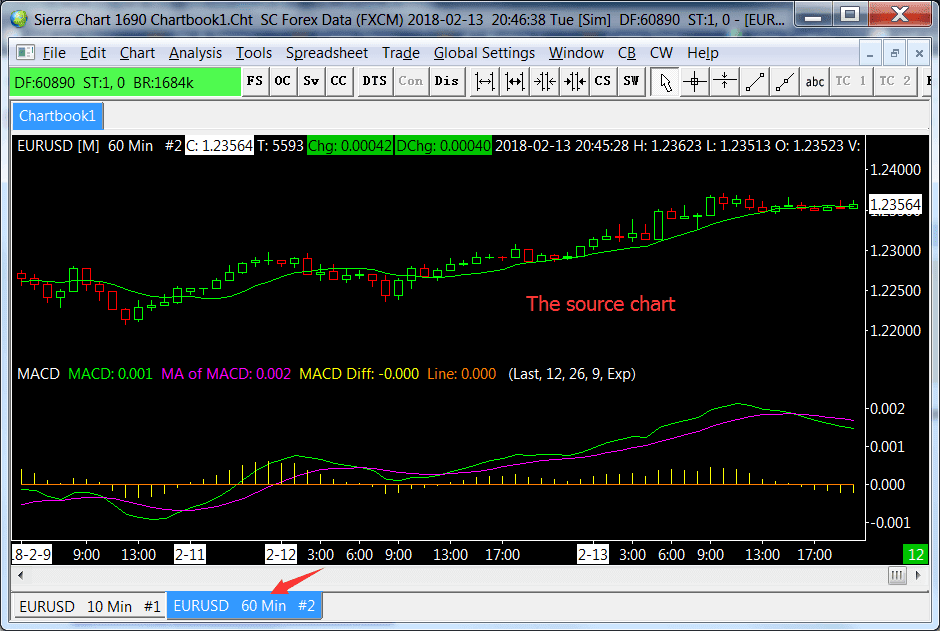
Second, you need to open another chart (the source chart) with a higher timeframe. If you want to use a MTF SMA and a MTF MACD on the , then add SMA and MACD to the source chart, as shown in below.


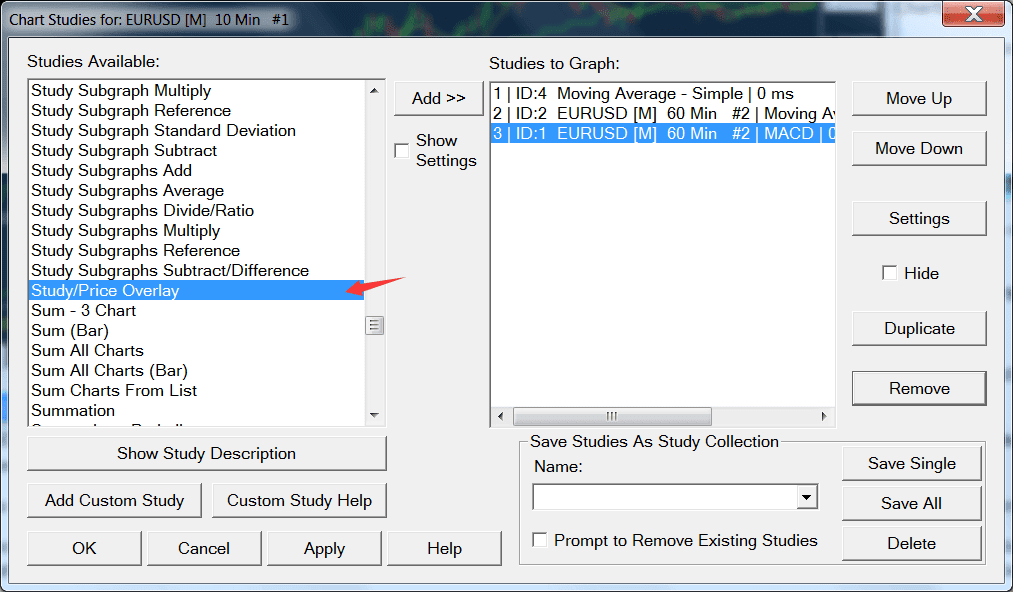
Then you can use the Study/Price Overlay study to add the indicator from a higher timeframe(source chart) to the main chart( destination chart), in this case, a MTF SMA and MACD.


What you need to do is adding two Study/Price Overlay study to the main chart as shown in below.


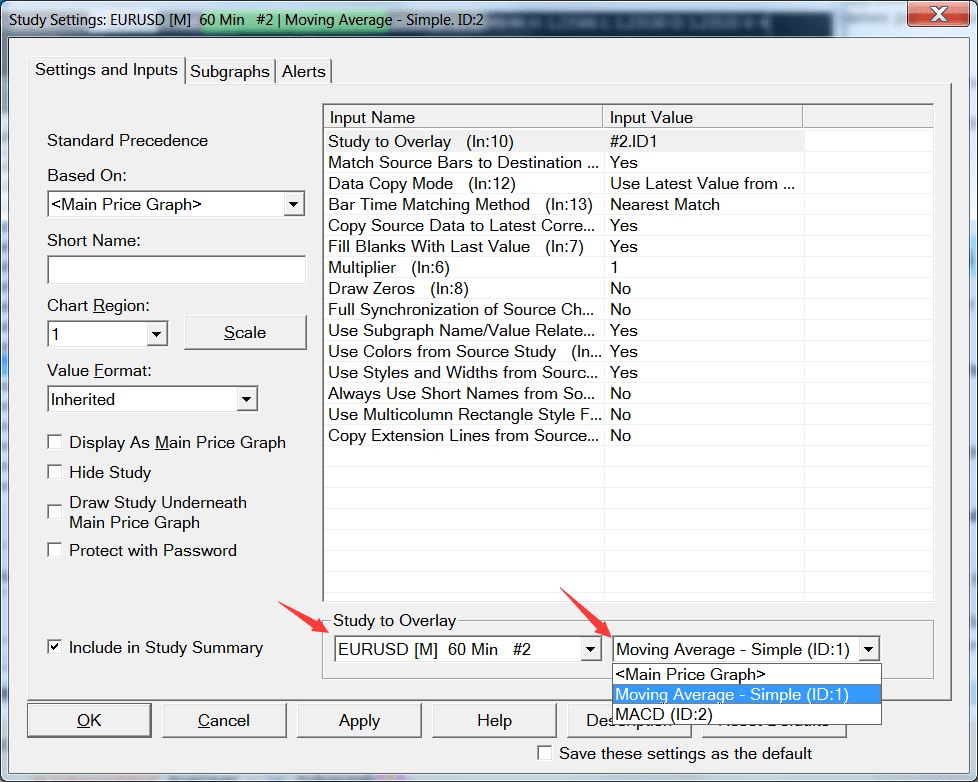
In the setting page of the Study/Price Overlay study, choose the source chart from the "study to Overlay" menu and select the indicator on the right side.


The above example shows how to add two indicators as MTF, if you only need one MTF indicator then you only need to add Study/Price Overlay study to main chart.


Please note that you don't add the Study/Price Overlay study on the destination chart.

Use the Study/Price Overlay study on the destination chart to reference the source chart data. Once you get the study configured as you require, then the data can be referenced from that study as explained below. If you cannot accomplish what you want with the overlay study, then what you require is not supported.


You can also check Sierra Chart's official docs: How to Overlay a Study or Main Price Graph From One Chart Onto Another Chart with a Different Timeframe per Bar or Symbol (Study/Price Overlay Study)