
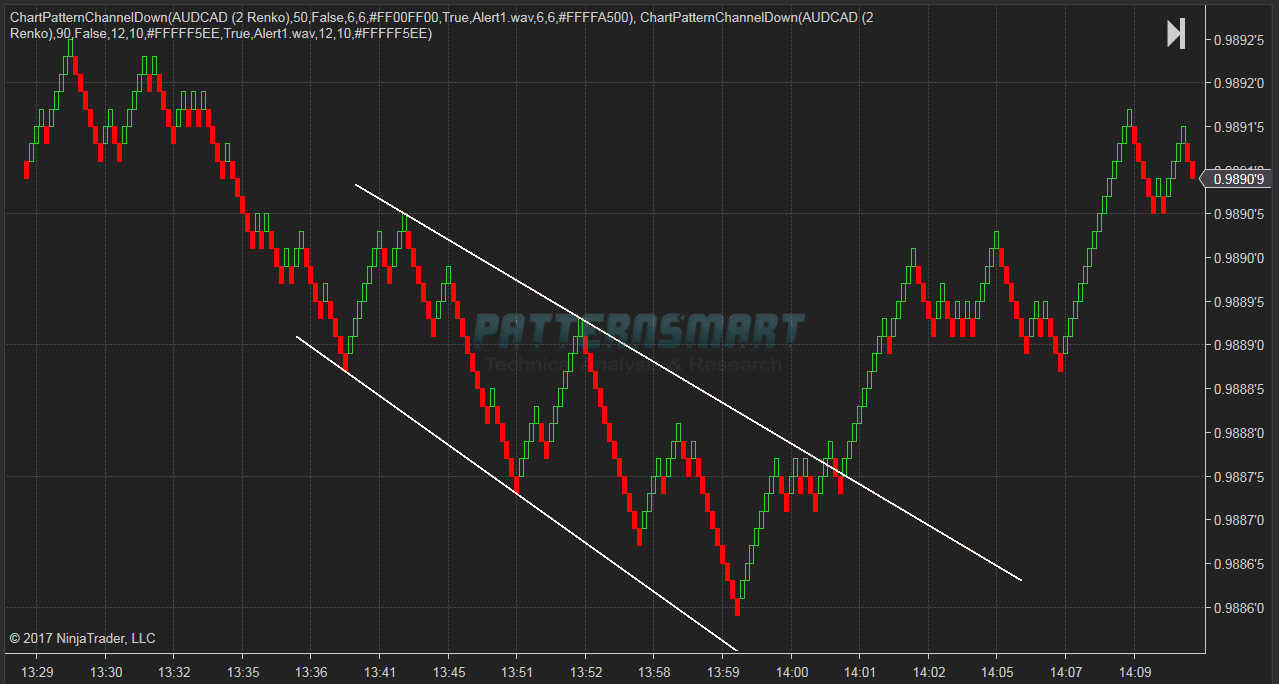
It will draw two trend lines of the Channel Down on chart when the pattern is formed.
Features:
- Drawing Channel Down chart pattern for both realtime and historical data.
- Adjustable length of pattern legs.
- Using different combination of parameters, you can easily identify the Channel Down pattern in short term, mid term and long term.
- It works on most of the time frames and chart types, including: minutes, daily, weekly, monthly, tick, renko, range, Heiken Ashi, etc.
- Adjustable length of extension lines.
- Switch for showing latest pattern only or show all history patterns found on chart.
- Select different sound alert files with switch.
- Editable trend line color.


Click an image to view at full size.
      |
      |
No comments:
Post a Comment