General description
Pennants are a common pattern in technical analysis and usually indicate a continuation of the current trend.
During an uptrend or a downtrend, the pennant pattern starts out with a steep up (or down) price
changes in conjunction with huge volume; then after a brief consolidation, the price continues the
original up (or down) trend. In most cases, the pennant pattern occurs in the middle of an up
(or down) trend, so it tends to be a very reliable continuation pattern and unlikely to reverse course, but there is no guarantee here and sometimes, the trend does change.
The shape of the pattern is a triangular-like flag with two equal hypotenuses, sloping in the opposite direction of the trend.
The formation of the pennant pattern is rather short, usually completed within one month.
Depending on whether the pennant appears in an up (or down) trend,
it’s called a bullish pennant or a bearish pennant, respectively.
Difference between Pennant and Triangle and Flag patterns
· The Pennant pattern is similar to the Flag pattern in most aspects of the Flag pattern, except that the
two trendlines converge with the Pennant converge, and is parallel in the Flag pattern.
· The Triangle does not require to start with a sharp price movement (Flagpole), whereas the other
two do.
· The formation time in the Pennant and the Flag pattern is short than that of the Triangle pattern.
· Both the Pennant and the Flag progress as a continuation of the previous trend in most situations,
whereas the Triangle pattern can be either continuation or reversal.
Bullish Pennant

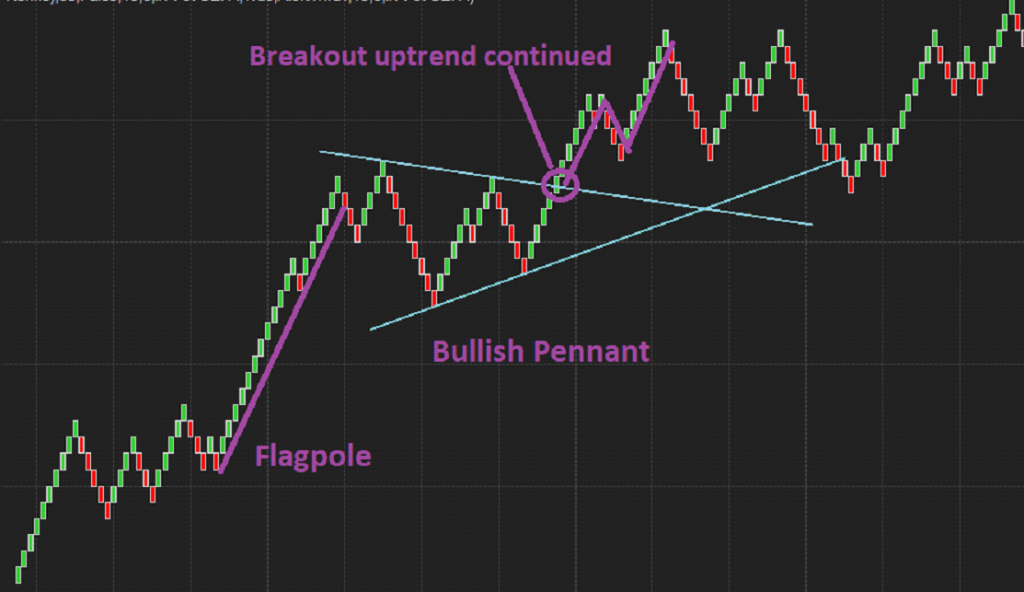
As the above chart shows, the bullish pennant occurs after a strong uptrend, and after a period of
consolidation, the price breaks above the upper resistance line. The breakout is generally viewed as
the beginning of a recovery in upside momentum. Notice the pullback is less than half of the flagpole,
if the retracement is too large, i.e., over 50% with heavy volume, the pennant pattern may fail.
A trader can consider entering a long position after the confirmation of the pattern with a candlestick
trade above the upper resistance line. For protection, the stop-loss can be set within the range of the pennant to prevent triggering too prematurely.
The theoretical target profit is the length of the flagpole, which is the vertical distance between
the two points. It is recommended to confirm the pattern with other technical indicators as well,
such as Moving Averages, Bollinger Bands, etc. In summary, the Bullish pennant pattern is a pause
in a strong uptrend, recognizing the pattern promptly will help a trader to capture the next momentum.
Our proprietary algorithm will automatically detect the Bullish Pennant chart pattern for you to trade
smarter.
Bearish Pennant

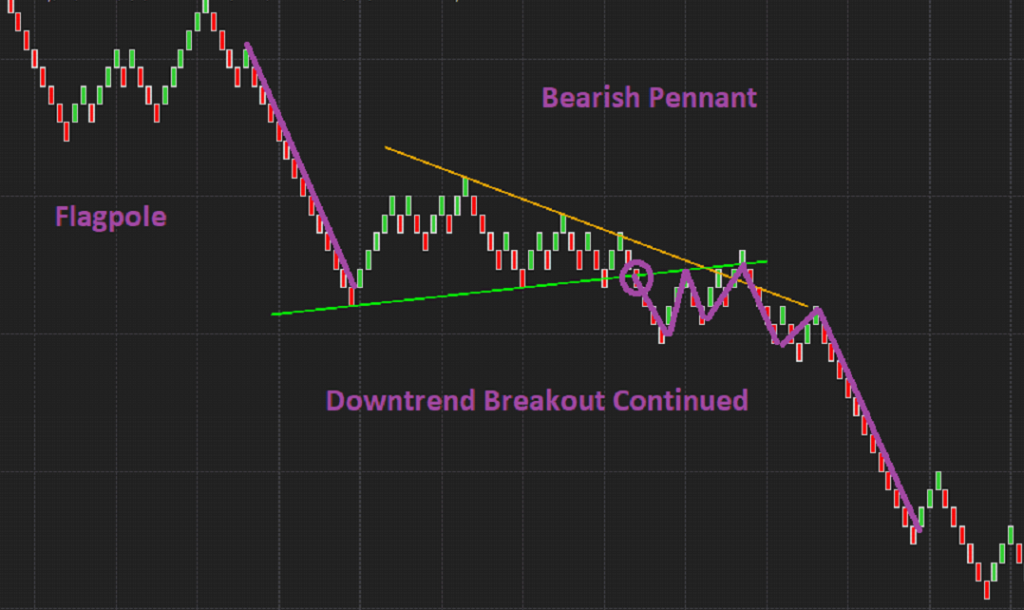
As in the chart above, the Bearish Pennant is the opposite of the Bullish Pennant pattern.
The two trendlines, upper resistance and lower support, converge with each other in a horizontal
direction. The price fluctuates in this area, and the range is getting smaller and smaller,
thus forming a decline Pennant shape. At the beginning of the formation, there is a steep decline in
the market, forming a “flagpole”; then after a period of consolidation, the previous downward trend
continues. The change in trading volume is quite apparent. First, when the flagpole is formed,
it is often accompanied by a huge trading volume, secondly, the volume gradually decreases with
the consolidation period, and lastly, when the market returns to the original trend, the huge trading
volume returned as well. When the price breakouts the lower support level (lower trendline)
of the Bearish Pennant pattern, a trader can consider entering a short position with the target price
set as the length of the flagpole. The Bearish Pennant mostly occurs in the first phase of the bear
market, indicating that the market has just started to fall, and there may be a larger decline lies ahead.
In summary, the Bearish Pennant is a very reliable continuation pattern, and it has distinctive
characteristics to be recognized for. Nonetheless, do not waste your precious time searching for it,
just like you wouldn’t make a hammer yourself if you want to build a house, our proprietary
algorithm can automatically detect this pattern for you. Our work is to provide effective tools for you,
so you can trade smarter and live better.
For more details about this indicator, please visit patternsmart.com


No comments:
Post a Comment