Showing posts with label ADX, Divergence, indicator, Thinkorswim TOS. Show all posts

Sunday, March 6, 2016

ADX Divergence Indicator all-in-one package for Thinkorswim

No matter what kind of strategy you have, timing is one of the most important elements in trading.

Everyone wants to be one step ahead of the game. But how and is it even possible?
A lot of traders rely on ADX indicator and most of them spend their day to stare at the charts for hours and waiting for ADX divergence to happen on current bar. Experienced traders can manage to follow multiple charts at the same time, if you are one of them, you know you have been doing this for years. 

Now, imagine an indicator can automatically generate a sound alert whenever there is an ADX Divergence on the chart, if you are away from your computer it can even send you a SMS. This is one step ahead of others.

If you need to watch dozens of symbols at the same time, the chart indicator cannot give signals for all of them unless you open dozens of charts which obviously not an option. In order to get Divergence signals for all symbols in your watchlist, the ADX Divergence Custom Quotes is your best solution. It's capable to show Divergence signals in all timeframes you chose with separate columns. This is another step ahead of others.

If you don't want to wait for the signals to appear on watchlist, the ADX Divergence SCAN makes it possible for you to search the whole market with ADX Divergence together with any other criteria you like to add. 
With these three products together, you are a few steps ahead of others.

This ADX divergence Indicator all-in-one package for Thinkorswim includes:

  1. ADX Divergence indicator for Thinkorswim TOS
  2. ADX Divergence signals Custom Quotes for Thinkorswim TOS
  3. Advanced ADX Divergence SCAN for Thinkorswim TOS
The file will be sent to your email after the payment is cleared.

http://www.patternsmart.com/cart/index.php?route=product/product&product_id=336&search=all-in-one+package 


Advanced ADX Divergence SCAN for Thinkorswim TOS

Advanced ADX Divergence SCAN for Thinkorswim TOS

This product is part of the:
ADX Divergence Indicator all-in-one package for Thinkorswim
 
This customized scanner will find all Positive/Negative (bearish/bullish) ADX Divergence based on your settings.
The algorithm of this SCAN is same as our ADX Divergence indicator.

This Advanced scanner is specially made for experienced traders.
For example, you can search ADX Divergence signals in a short range, such as 15 bars(applicable to any time period).
You can also search in a long range, such as 60 or 100 bars. Furthermore, you can specify the percentage of price change between 2 Highs/Lows and the percentage of ADX value change which are used to find the Divergence.
It makes possible to scan on very complex conditions.
Example 1, scan Negative (bearish) ADX Divergence if current High is the peak within 15 bars, and it's 5% greater than the peak from 25 bars ago. At the same time, the current ADX value is 8% less than the ADX value of that peak from 25 bars ago.
Example 2, scan Positive (bullish) ADX Divergence if current Low is the trough within 5 bars, and it's 3% less than the trough from 15 bars ago. At the same time, the current ADX value is 10% greater than the ADX value of that trough from 15 bars ago.

Features:
  • You can change all ADX (Relative Strength Index) parameters:
    • ADX length: The number of bars used to calculate the ADX.
    • average type: The type of moving average to be used in calculations: simple, exponential, weighted, Wilder's, or Hull.

  • Length 1&2: Define the range of bars which are used to calculate the current High/Low and previous High/Low.
  • Percent: The difference current High/Low and previous High/Low.
     
  • ADX_Percent: The difference between current ADX and the ADX value from previous High/Low.
  • Scan in any time frames, 5mins, 15mins, 30mins, 1 day, 1 week, 1 month.
  • Applicable for all securities(Stocks, Futures, Forex, Options, ETF, etc.).

ADX Divergence signals Custom Quotes for Thinkorswim TOS

This product is part of the:ADX Divergence Indicator all-in-one package for Thinkorswim
 

This custom study will help you to quickly identify the ADX Divergence signals in the Watchlist.
It will detect all Positive/Negative (bearish/bullish) ADX Divergence based on your settings.
The algorithm of this Custom Quotes is same as our ADX Divergence indicator.

Parameters:
  • You can change all ADX (Relative Strength Index) parameters:
    • ADX length: The number of bars used to calculate the ADX.
    • average type: The type of moving average to be used in calculations: simple, exponential, weighted, Wilder's, or Hull.
  • Length 1&2: Define the range of bars which are used to calculate the current High/Low and previous High/Low.
  • Percent: The difference current High/Low and previous High/Low.
     
  • ADX_Percent: The difference between current ADX and the ADX value from previous High/Low.
  • Scan in any time frames, 5mins, 15mins, 30mins, 1 day, 1 week, 1 month.
  • Applicable for all securities(Stocks, Futures, Forex, Options, ETF, etc.).


The pictures only show 3 different timeframes.
But you can have all of the timeframes listed on the screen at the same time in different columns.

ADX Divergence indicator for Thinkorswim TOS


This product is part of the:ADX Divergence Indicator all-in-one package for Thinkorswim

The Average Directional Index (ADX) is calculated as a moving average of the directional index. ADX is used for trend strength evaluation.

High ADX values might indicate that the market is trending, while low values are considered to signify weak trend or non-trending conditions.

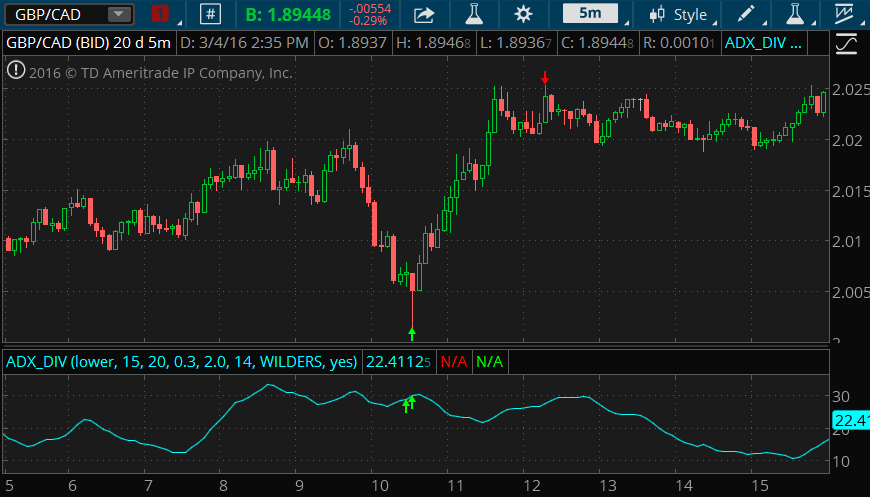
Divergence indicator gives possible reversal signals when there are discrepancies between ADX and price movement.

Divergence emerges when price and oscillator indicator move in different directions. 

For instance, an uptrend Negative Divergence occurs when price reaches a higher high, but the indicator fails to follow.
In a downtrend, positive divergence occurs when price reaches a lower low, yet the indicator does not reach a lower low.
For the most part, oscillator indicators and price trailing each other and move in the same direction.
However, when they start to drift apart, the current trade may consolidate or exhibit a reverse pattern. 


Parameters:
  • You can change all ADX (Relative Strength Index) parameters:
    • ADX length: The number of bars used to calculate the ADX.
    • average type: The type of moving average to be used in calculations: simple, exponential, weighted, Wilder's, or Hull.
  • Length 1&2: Define the range of bars which are used to calculate the current High/Low and previous High/Low.
  • Percent: The difference current High/Low and previous High/Low.
     
  • ADX_Percent: The difference between current ADX and the ADX value from previous High/Low.
  • Alert: provide both sound and message alert whenever a divergence is found. You can turn it on or off.
  • mode: Choose "Upper" to only plot signal arrows on price chart.
    Choose "lower" it will plot as a Stochastic  indicator with divergence signals.
 
Please note: in order to plot this indicator on both price chart and lower chart, you need to load it in two places. And set Stochastic _mode to "Upper" in Price chart and Stoch _mode to "lower" in Lower chart. As shown in the following picture.
If you want the same signals on both charts, all parameters have to be consistent on both sides.


This indicator works in any time period and applicable for all securities(Stocks, Futures, Forex, Options,ETF, etc.).
When you use this indicator in minute chart, it's better to set "percent" less than 1, otherwise, lots of signals will be filtered.

If you want to add any feature to this indicator, please send us a Customization request.


How to use:
The purpose of divergence indicator is to point when price  trend are moving into  opposite direction.