The Parabolic SAR (Stop And Reverse) technical indicator is a study for analyzing trending markets.
When
the price is in an uptrend, the SAR appears below the price and
converges upwards towards it. Similarly, on a downtrend, the SAR appears
above the price and converges downwards.
If the price crosses
Parabolic SAR lines, the indicator switches so that its further values
are located on the other side of the price. When such an indicator
switch occurs, the maximum or the minimum price for the previous period
would serve as the starting point. When the indicator switches, it
indicates a the trend end (correction stage or flattening) or the trend
reversal.
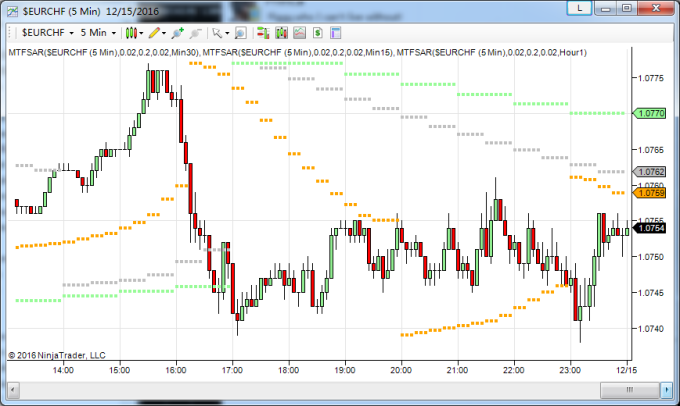
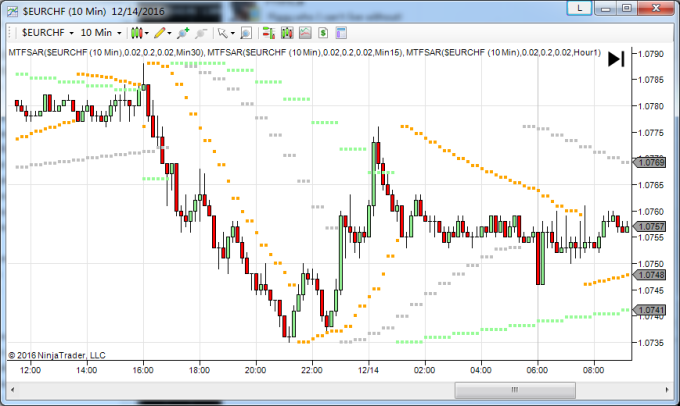
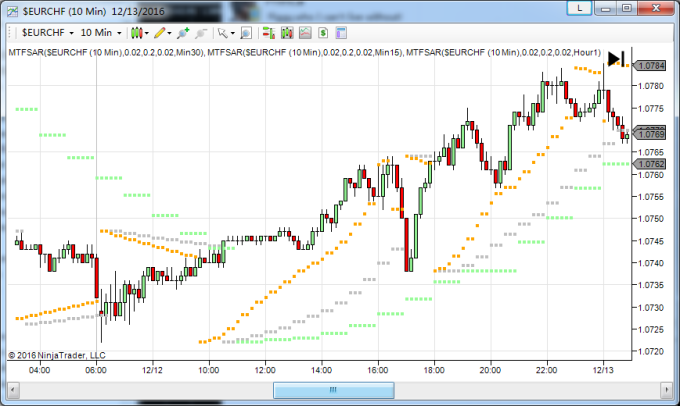
With this MTF version Parabolic SAR, you can apply any time frame of
Parabolic SAR to your current chart.
As long as the selected time frame is greater
than the current time frame.
You can have 30 minutes or 60 minutes
Parabolic SAR on a 5 minutes chart, or having weekly Parabolic SAR on Daily
chart
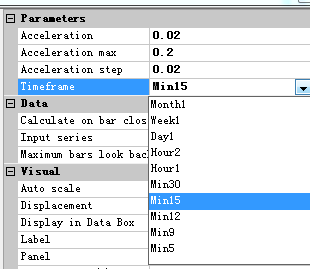
Input Parameters
acceleration factor: The initial value of the acceleration factor.
acceleration limit: The maximum value of the acceleration factor.
Get it now: http://www.patternsmart.com/cart/index.php?route=product/product&path=73&product_id=300&limit=100
All time frames:
|
| | | | | | | | |