Showing posts with label tradingview. Show all posts

Sunday, August 11, 2019

How to find tradingview indicator scripts on TradingView

After the new update we can no longer search invite-only and private indicators directly from the chart page on TradingView.


In order to use our indicators, please follow the steps below:

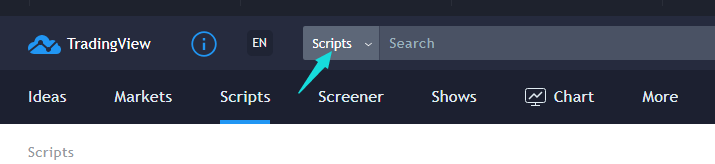
1: Select the 'Secripts' option beside the Search field and enter our indicator's name such as TPR.


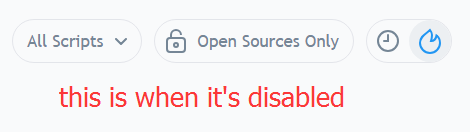
2. If you can't not find our indicator please make sure you turn off the "Open sourced only".
The "Open sourced only" option will turn gray if you disabled it.


 By default, the "Open sourced only" option is enabled as shown in the picture below:


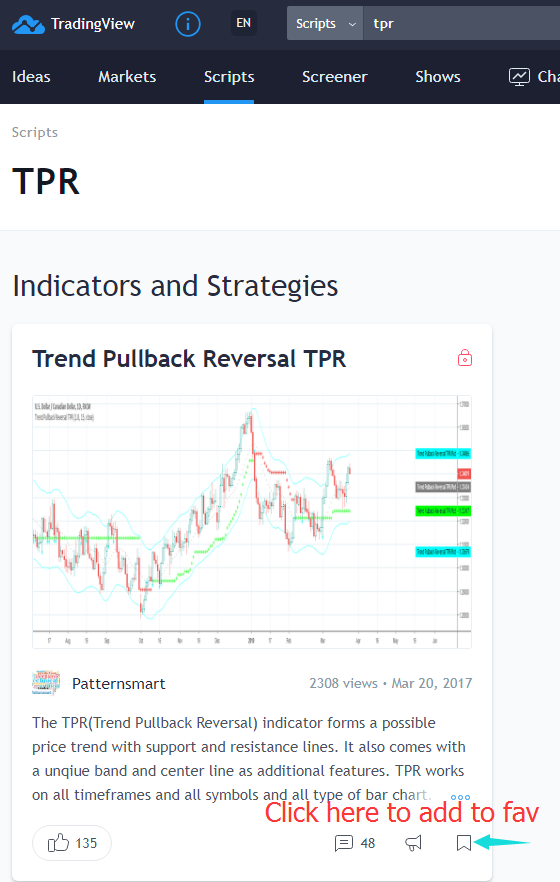
3. After you find our indicator from the search result, please add our indicator to favourite.
To do that please click the icon as shown in the picture below.


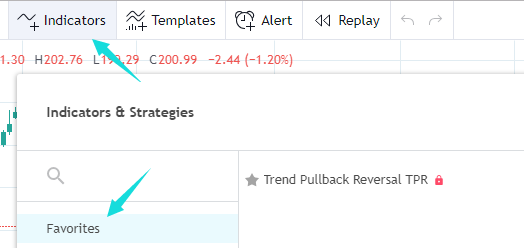
4. After you added our indicator to favourite, you can find that indicator from the Indicators section on chart as shown in below:


Friday, August 31, 2018

How to create an indicator in pine editor tradingview


PineScript is the coding language of TradingView, which allows users to create customized studies and signals and run them on TradingView servers.

First of all, you need to create a new indicator script, you can find this option as shown in the image below.


Once you open the Pine Editor, remove the default codes first, then copy and paste all the code I sent to you, make sure you don't forget to save it.


After the new indicator is saved, you can open it at anytime from the "Open"---"My script" tab.


Friday, August 3, 2018

tradingview chart and indicator scale issue


Sometimes you may see the indicator plot unexpected, most of the time it's because the scale of the chart symbol and indicator didn't match each other.

You can check your chart symbo's scale from the pointed button in the image below:


In default, it's Scale Right for the chart symbol.

You must use the same scale for the indicator, in this case, the Scale Right in order to make it plot correctly.

You can set indicators' scale from :


If you use Scale Right for the chart symbol, but a different scale type for indicator, then you will encounter issues.


Thursday, November 23, 2017

Flow of Fund divergence indicator and alert for Tradingview


The Flow of fund(FOF) divergence signal indicator consists of the following parts: The Flow of fund histogram, FOF trend line and divergence signal. The signal is instantly drawn on current bar and will not repaint.


HISTOGRAM shows an approximate amount of money get in or out of the market within 1 bar. If selling pressure is stronger than buying pressure, it will be a red histogram, otherwise, it will be a green histogram.

Flow of fund trend line indicates the short or long term movement of the flow, determined by the "Length of FOF" input you set.

In order to keep it simple, there are only two inputs.


Divergence

The divergence signal has two types, bearish and bullish. 

 
A bullish divergence occurs when the price hit a lower low and the FOF line is in uptrend. A down arrow will be drawn above the current FOF line when there is a bearish divergence between FOF and price trend. 


A bearish divergence occurs when the price hit a higher high and the FOF line is in downtrend.
A up arrow will be drawn below
price candle bar when there is a bullish divergence between FOF and price trend.


To add alerts for both bearish and bullish signals, please follow the pics below.


The following images show how it works on different chart types and timeframes.


It works on Heikin Ashi.


It works on Renko


Tuesday, October 31, 2017

Multi Time Frame MTF Correlation Coefficient indicator for tradingview

Multi Time Frame MTF Correlation Coefficient indicator

This indicator shows the Correlation Coefficient between the four input symbols and current chart symbol over the corresponding timeframe and period inputs.


You can input four symbols with different aggregation and period settings.
The period input is the number of bars used to calculate the correlation coefficient.


How to Read the Correlation Coefficient indicator

Each dot shows the correlation coefficient between the two symbols over the corresponding timeframe and period inputs. The following categories indicate a quick way of interpreting the table values. Note that a negative correlation means the two currency pairs correlate in the opposite directions (e.g. when the price for one goes up, the other one goes down and vice versa)


  • Positive 0.0 to 0.25 weak correlation, shown as small cyan dot.
  • Positive 0.25 to 0.5 Moderate correlation, shown as medium light blue dot.
  • Positive 0.5 to 0.75 Strong correlation, shown as big light blue dot.
  • Positive 0.75 to 1.0 Very strong correlation, shown as large blue dot.
  • Negative 0.0 to 0.25 weak correlation, shown as small orange dot.
  • Negative 0.25 to 0.5 Moderate correlation, shown as medium orange dot.
  • Negative 0.5 to 0.75 Strong correlation, shown as big purple dot.
  • Negative 0.75 to 1.0 Very strong correlation, shown as large red dot.

You can also change the plot style to meet your needs.


Tuesday, April 11, 2017

MTF Trend indicator for Tradingview Multi Time Frame Trend 4 in 1 indicator


Price can be up trend and downtrend simultaneously in different timeframes.
Experienced traders know the importance of looking at Multiple Time Frames.
Analyzing multi time frame chart allows trader to have a greater view on the price action.

This MTF trend indicator shows the trend of current time frame and 3 higher time frames in a single chart. In addition, it will check the consistence of all 4 time frames. It will not repaint.

It will only work on time based charts. Tick and range charts are not supported.

The green dots represent uptrend, and the red dots represent downtrend.


The 'trend period' is used to measure the direction of price within the given number of bars.

The dots of value 1 at the bottom is the trend of 'timeframe 1'
The dots of value 2 is the trend of 'timeframe 2'
The dots of value 3 is the trend of 'timeframe 3'
The dots of value 4 is the trend of current timeframe.

If current and 3 higher time frames are in the same direction, the dots at the top will appear.
Otherwise, there will be no dots at value 5. 


'timeframe1' 'timeframe2' and 'timeframe3' must be higher than current timeframe, if your chart is 15min, 'timeframe1' 'timeframe2' and 'timeframe3' must be 20min or higher.


It will highlight bars when trends are inconsistent in different timeframes.
You can change the highlight color, or disable this feature.

The highlighted bars represent the situation where price may change its direction from previous trend, or in a short-term adjustment.





Wednesday, April 5, 2017

Tradingview double top chart pattern detector indicator with alert

VIP price: $29   This is a Permanent access license, please provide your Tradingview ID along with your payment.

Double top is a very common chart pattern, as its name indicates, it consists of two tops, and these two tops need to be in a relative flat price level. One of the top can't be much higher or lower than the other.
This indicator will detect and highlight double top pattern automatically on chart and alert you via SMS, email and sound.

Features:
  • Adjust the number of bars used to form each top.
  • Check if the first top is the highest in a given number of bars
  • Adjust the number of bars between two tops.
  • Alert when a pattern is formed.


The Strength input is the number of bars used to form each top, it's the number of bars on the left and right side of the swing high and low.


For example, if you set it to 5, the cyan line will be drawn at bar A, it also alerts at this bar.


The Top Range input is used to check if the first top is the highest high in a given number of bars, if you set it to 60, then High A(in the pic above) is the highest high for 60 bars on its left side.


The double top pattern is not always symmetrical, luckily we can use the input “# of bars between 2 tops” to filter out some unwanted ones. If you only want a pattern when the two tops within a small range, then set this input to a small number such as 10.


It’s suggested to load more than one of this indicator with different input set to get more results.

It works on all timeframes and any symbol. It will draw a line right after the pattern is formed.
You can also load more than one with different inputs to get more results on chart.