All of our Ninjatrader 8 CHART PATTERN indicator can be used as scan filter in Market Analyzer.
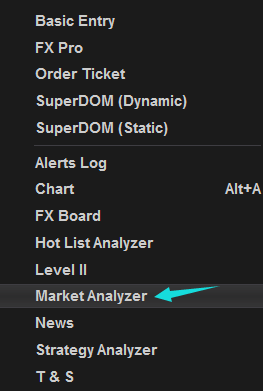
You can access the Market Analyzer window from within the NinjaTrader Control Center window by left mouse clicking on the menu New, and then selecting the menu item Market Analyzer.

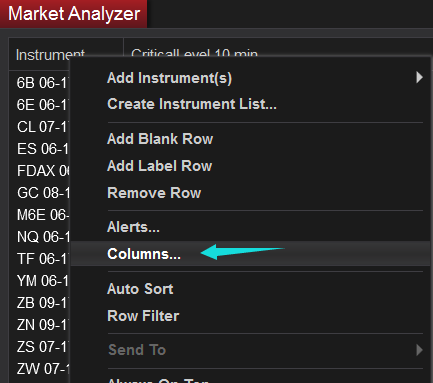
After you open the Market Analyzer window, right click and select 'columns'.
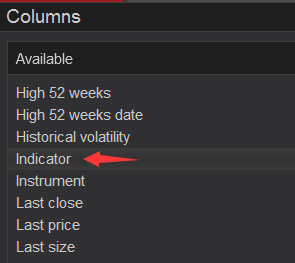
You will see all available columns now, go to 'Indicator'.
Select the chart pattern you want to use:
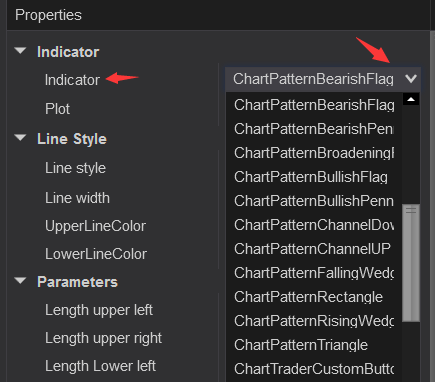
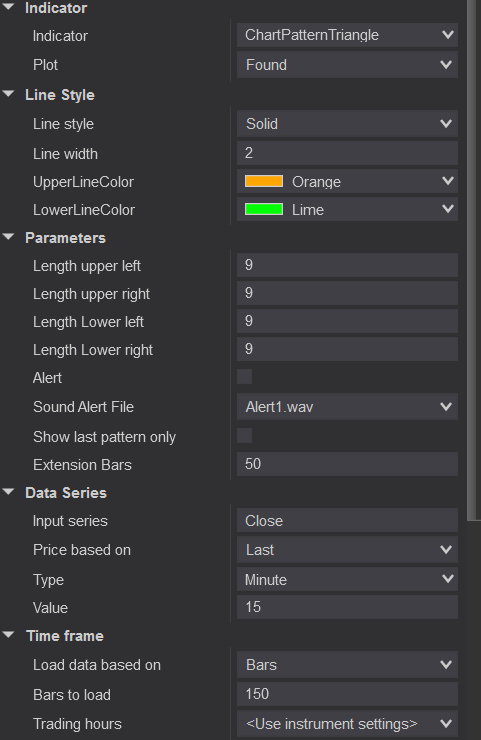
After you select one of them you should see all of its inputs as the pic below.
Make sure you load at least or more than 150 bars.
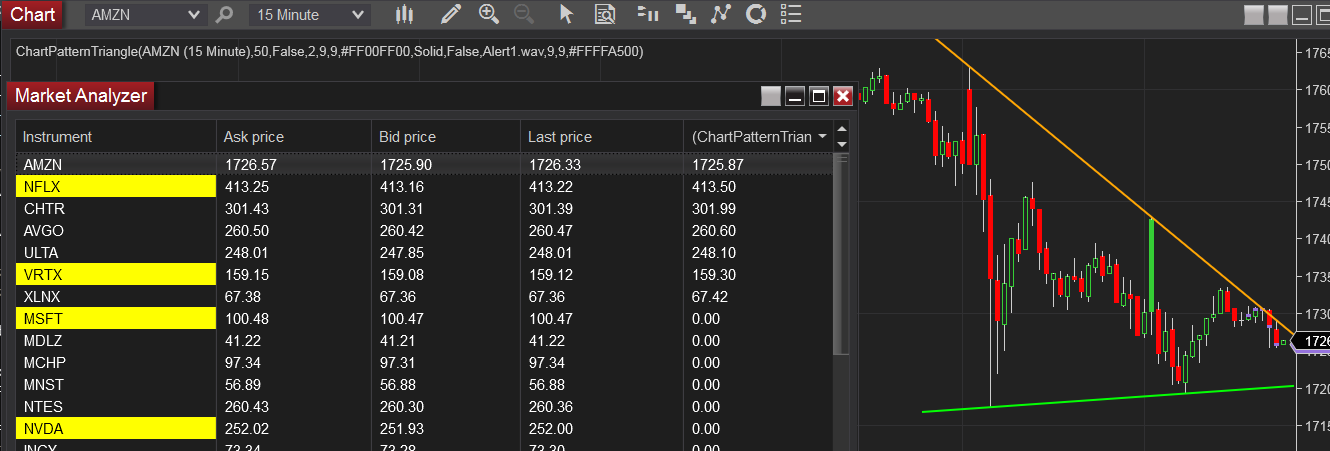
If there was a chart pattern found with your settings the column would display a value greater than 0. If there was no pattern found it would display 0.
If you want to use it as a scan filter, you need to add a Filter condition(Not Cell condition).
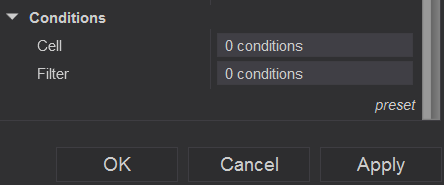
Please use the following settings in order to filter out symbols without a pattern found.

To enable/disable filtering press down on your right mouse button in the Market Analyzer window and select the menu Row Filter. When enabled, the Market Analyzer will filter out rows from the grid display based on the Filter Conditions of the columns.
The image below is an example of a list of symbols after 'Row Filter' enabled.

Please do not add more than one filter unless you know what you are doing.
Here is a link of How to use ninjatrader Market Analyzer


No comments:
Post a Comment