We provide many different kind of products and services related to technical analysis.
We help traders to refine their strategies and optimize their trading tools.
This is a Permanent access license. Please follow these “3rd
Party Licensing” steps within NinjaTrader, to properly enable your license
for any of the NinjaScript.
A Google drive download link will be sent to you after your ID is activated.
Double top is a very common chart
pattern, as its name indicates, it consists of two tops, and these two
tops need to be in a relative flat price level. One of the top can't be
much higher or lower than another one.
This indicator will detect and highlight double top pattern automatically on chart and alert you. Features and inputs:
Range(input): check if the first top was the highest High in given Range of bars.
Strength(input): minimum number of bars used to form each top.
Choose the alert sound file you want to use from a drop down menu.
Switch ON/OFF of alert.
It works on all timeframes and any symbol. It will draw a line right after the pattern is formed. You can also load more than one with different inputs to get more results on chart.
There is a plot (a cyan dot) which is used check if a double top chart pattern has been formed.
You can use this plot in Market Analyzer and Strategy.
All of our Ninjatrader 8 CHART PATTERN indicator can be used as scan filter in Market Analyzer.
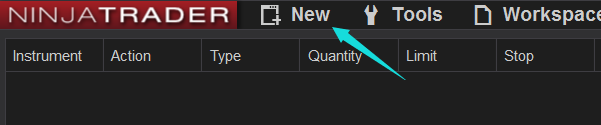
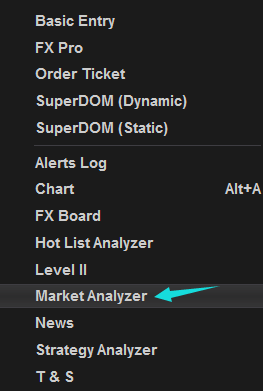
You can access the Market Analyzer
window from within the NinjaTrader Control Center window by left mouse
clicking on the menu New, and then selecting the menu item Market
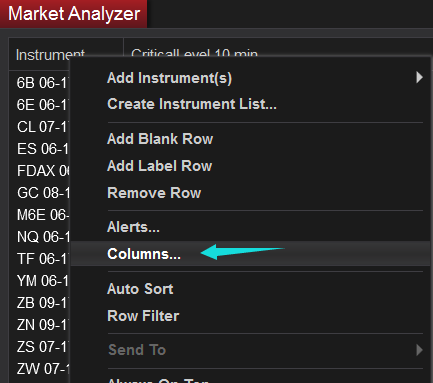
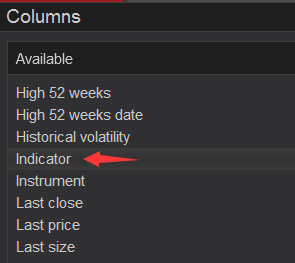
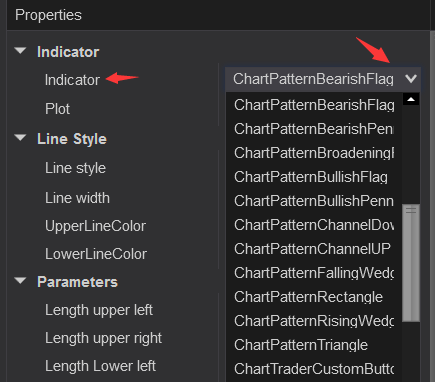
Analyzer. After you open the Market Analyzer window, right click and select 'columns'. You
will see all available columns now, go to 'Indicator'.
Select the chart pattern you want to use:
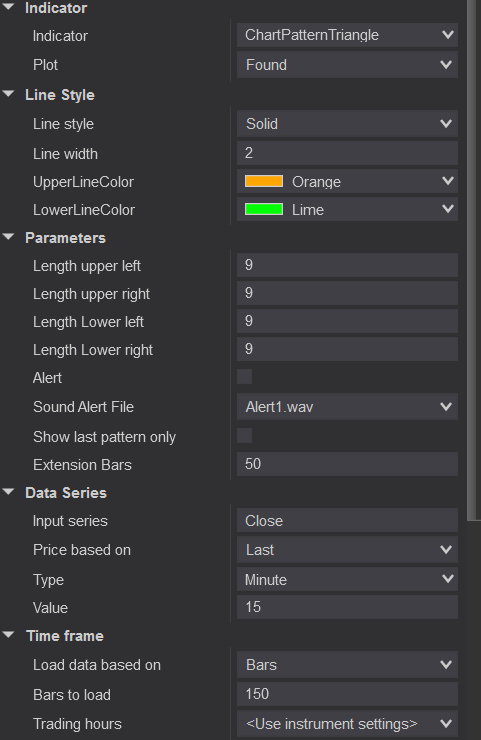
After you select one of them you should see all of its inputs as the pic below. Make sure you load at least or more than 150 bars.
If there was a chart pattern found with your settings the column would display a value greater than 0. If there was no pattern found it would display 0.
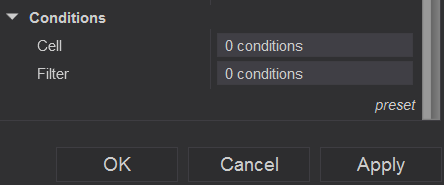
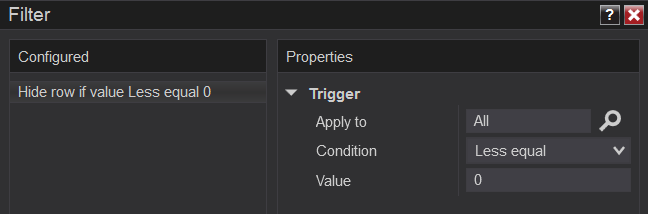
If you want to use it as a scan filter, you need to add a Filter condition(Not Cell condition).
Please use the following settings in order to filter out symbols without a pattern found.
To enable/disable filtering press down on your right mouse button in the Market Analyzer window and select the menu Row Filter. When enabled, the Market Analyzer will filter out rows from the grid display based on the Filter Conditions of the columns.
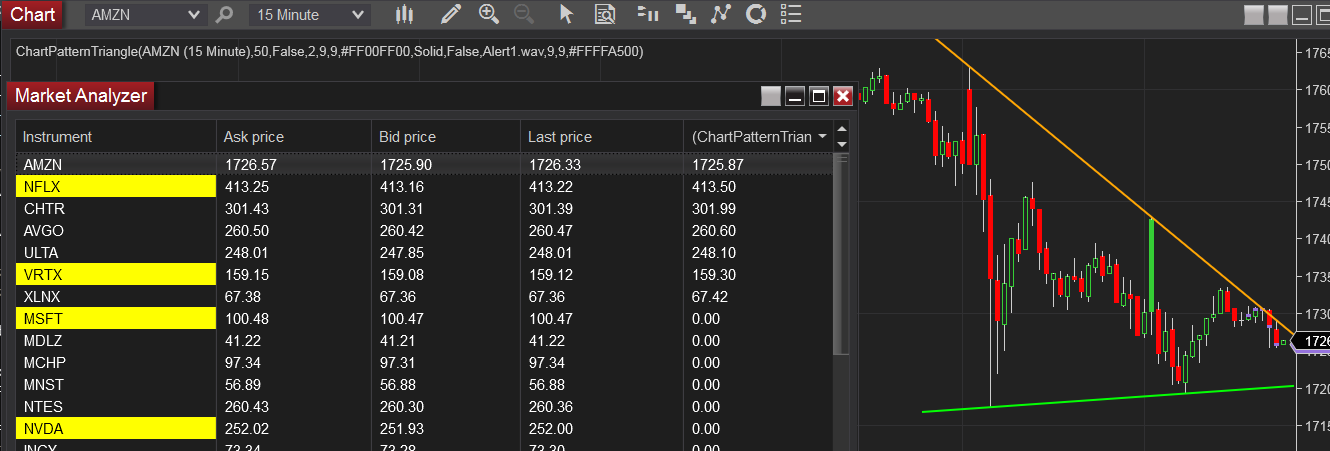
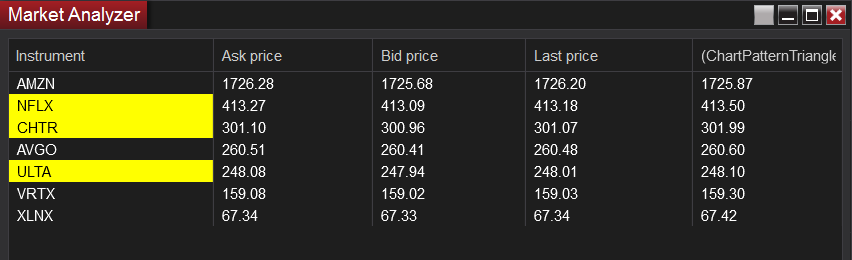
The image below is an example of a list of symbols after 'Row Filter' enabled.
Please do not add more than one filter unless you know what you are doing.
XABCD
5-point chart patterns are very common and popular in technical
analysis, some of them have already been named, such as Gartley,
Butterfly, Bat, Crab, Shark and Cypher.
As
the name suggests, XABCD pattern has 5 points and 4 legs formed by
those 5 points. The concept of XABCD 5-point pattern is to compare the
retracement level between legs. For example, when you see AB makes a
0.382 or 38.2% Fibonacci retracement of the X-A leg or XA, it means that
the price difference from point A to B is equal to 38.2% of the price
difference from point X to A. If we use a formular to represent the relation, it will be: (B-A)=0.382*(X-A);
This indicator is able to detect and highlight any Bullish M shape XABCD 5-point chart pattern based on your pre-defined settings, and plots the fibonacci retracement automatically.
The following video shows how it plots in realtime.
How it works:
It
uses Zigzag to track the price trend and detect all four legs based on
your settings. If there are four adjacent legs that meet the retracement
levels you set, it will highlight the XABCD 5 points, plot two
triangles and draw the Fibonacci retracemen lines. The image below is an
example of what this indicator plots on chart.
Features:
Automatically highlight the M shape XABCD 5 points pattern and shade the triangle XAB and BCD.
You will be able to change the outline color for those 4 legs, XA, AB, BC and CD.
You will be able to change the shade color and transparent level of the two triangles XAB and BCD.
Automatically draw Fibonacci retracement levels with ON/OFF switch,
adjust how many bars used for the extension of fibo levels.
select Right or Left side to show the fibo values.
Plot a projection (not prediction) of the D point when XABC is confirmed.
Enable to turn this feature ON/OFF.
If the actual D point is detected, the projection will be removed.
Show XABCD patterns on history data, if turn this feature OFF, it will only plot the last one XABCD pattern.
Sound alert whenever a XABCD pattern is detected.
Select different alert sound files with drop down menu.
Adjust the Zigzag parameters:
Zigzag deviation type: percentage or point
Zigzag deviation value.
Switch ON/OFF to show Zigzag line.
The
retracement levels in some of the XABCD patterns definition are
theoretical values, it's not realistic to set the retracement as a fixed
value such as 0.618, since you may not be able to find any pattern in a
short time.
It's
better to set the value as a range. For example, if you want to detect
0.618 retracement from AB to XA, then set a range from 0.6 to 0.64 will
be more practical. Set the inputs as: ratio AB:XA <=0.6 and ratio AB:XA >=0.64.
Define the retracement between legs as shown in the picture below.
If you want to compare BC and XA instead of BC and AB then enalbe BC:XA, it will disable BC:AB automatically. Same for CD:XC.
Show XABCD patterns on history data, if turn this feature OFF, it will only plot the latest XABCD pattern.
Otherwise, it will keep all qualified patterns on chart. But only the last one will show Fibonacci retracement levels.
The following chart is a pattern on history data.
It will not plot retracement levels on historical patterns.
The following chart is an example of how projection mode works.
The following chart is an example of how customized XABCD ratio works. You can set the ratios to any value you want.
I set the ratios of AB:XA and CD:BC to a range around 1, then the shape will be a M top or double top pattern as shown in below.
Please make sure you have enough bars loaded on chart.
You can also use this indicator to capture any XABCD pattern as well as the ones that already been named.
The following example shows how to use this indicator to detect Cypher Pattern.
Cypher Pattern Rules:
The Cypher pattern starts with the X and A points.
Point B is confirmed when AB retraces to 0.382 – 0.618 Fibonacci level of the leg XA
Point C is confirmed when BC extend the XA leg by at least 1.272 or within 1.130 – 1.414 Fibonacci extension level
Point D is confirmed when CD retraces 0.782 Fibonacci level of XC
The image below is the parameters for bullish Cypher Pattern, since it uses BC:XA and CD:XC, you need to enable those settings.
The following example shows how to use this indicator to detect bullish Gartley pattern.
Gartley pattern rules:
Leg AB should be the .618 retracement of leg XA.
Point C is confirmed when BC retraces either .382 or .886 of AB.
If the retracement of BC is .382 of AB, then CD should be 1.272 of BC. If BC is .886 of AB, then CD should extend 1.618 of BC.
CD should be .786 retracement of XA.
The following example shows how to use this indicator to detect bullish Butterfly pattern.
Butterfly pattern rules:
Move AB should be the .786 retracement of move XA.
Move BC can be either .382 or .886 retracement of move AB.
If the retracement of move BC is .382 of move AB, then CD should be
1.618 extension of move BC. Consquently, if move BC is .886 of move AB,
then CD should extend 2.618 of move BC.
CD should be 1.27 or 1.618 extension of move XA.
Since
the legs are based on Zigzag line, please make sure you set the proper
input for zigzag first, otherwise you may not be able to detect the
desired patterns. This is a life time license, no subscription or renew fee.