Showing posts with label scan. Show all posts

Saturday, January 3, 2026

Mastering Multi-Timeframe RSI Divergence indicator, scan, watchlist(custom quotes) for Thinkorswim TOS: A Powerful Tool for Technical Analysis

Introduction to RSI and Divergence

The Relative Strength Index (RSI) is one of the most widely used momentum oscillators in technical analysis, developed by J. Welles Wilder in 1978. It measures the speed and change of price movements on a scale from 0 to 100, typically using a 14-period setting. Readings above 70 indicate overbought conditions, while those below 30 suggest oversold territories. However, RSI's true power lies beyond simple overbought/oversold levels—it's in identifying divergences, which signal potential shifts in market momentum.
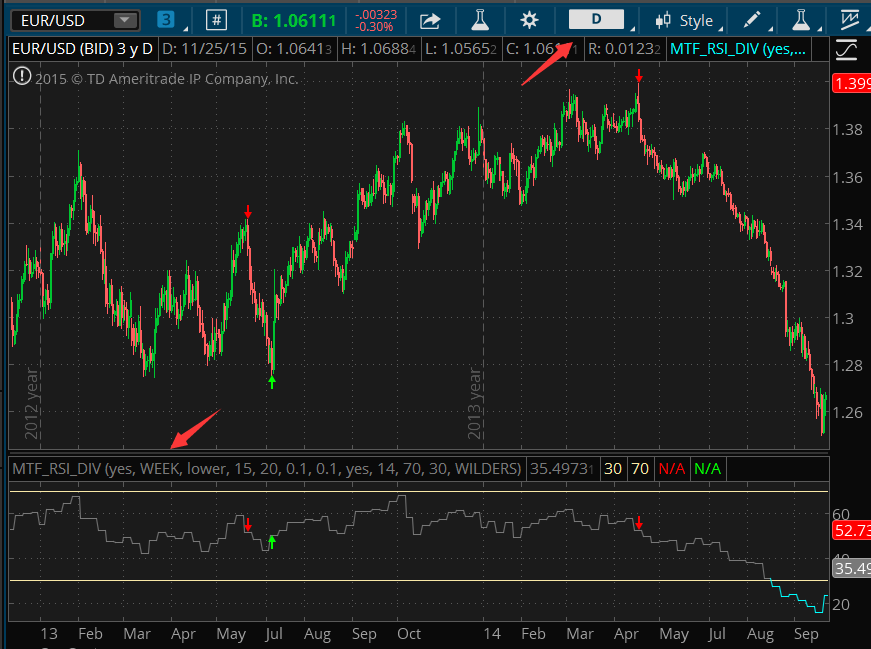
The Multi-Timeframe RSI Divergence Indicator for Thinkorswim TOS: A Comprehensive Guide for Technical Analysis 

Divergence occurs when the price action and the RSI oscillator move in opposite directions, highlighting a weakening trend. There are two main types:

  • Regular (Classic) Divergence: Often signals trend reversals.
    • Bearish: Price makes a higher high, but RSI forms a lower high (momentum fading in an uptrend).
    • Bullish: Price makes a lower low, but RSI forms a higher low (momentum building in a downtrend).
  • Hidden Divergence: Typically indicates trend continuations.
    • Bearish: Price makes a lower high, but RSI forms a higher high (continuation of downtrend).
    • Bullish: Price makes a higher low, but RSI forms a lower low (continuation of uptrend).

While standard RSI divergence is effective, it can produce false signals in volatile markets or when confined to a single timeframe. This is where the Multi-Timeframe (MTF) RSI Divergence indicator shines, allowing traders to overlay divergence signals from higher timeframes onto their current chart for enhanced confirmation.

Overview of the MTF RSI Divergence Indicator

The MTF RSI Divergence indicator, available from PatternSmart, is designed for platforms like Thinkorswim (TOS), with adaptations for other systems such as NinjaTrader 8 in similar variants. It builds on the standard RSI divergence by incorporating multi-timeframe analysis, enabling traders to detect divergences from longer periods (e.g., hourly or daily) directly on shorter-term charts (e.g., 5-minute). Key highlights from its description include:

  • No Lag or Repaint: Signals are generated in real-time at the current bar, ensuring reliability without hindsight bias.
  • Detection of Both Regular and Hidden Divergences: It automatically identifies all four signal types (bullish/bearish regular and hidden) between price trends and RSI values.
  • Customizable Plots: Features separate plots for each divergence type (e.g., Bullish Regular Signal, Bearish Regular Signal), which can integrate with scanners, watchlists, market analyzers, or automated strategies.
  • Alert Functionality: Includes customizable alerts for new signals, helping traders stay informed without constant chart monitoring.
  • Scan and Watchlist Integration: Compatible with platform tools for screening multiple assets or building divergence-based watchlists.

Parameters typically include:

  • RSI Length: Default 14, adjustable for sensitivity (shorter for more signals, longer for fewer but stronger ones).
  • Timeframe Selection: Choose the higher timeframe (e.g., 15-min, 30-min, 60-min, daily) to overlay on the base chart.
  • Lookback Period: Defines how many bars back to check for swing highs/lows (e.g., 3-10 bars for accurate swing detection).
  • Overbought/Oversold Thresholds: Custom levels (e.g., 70/30) to filter signals

This indicator is particularly suited for intraday and swing traders using futures, stocks, forex, or cryptocurrencies, as it leverages MTF to provide a broader market context.

How to Set Up and Use the MTF RSI Divergence Indicator

Setting up the indicator is straightforward on supported platforms like Thinkorswim:

  1. Installation:
    • Download and import the indicator file into your platform (e.g., via Thinkorswim's "Studies" menu).
    • Add it to your chart by selecting "MTF RSI Divergence" from the studies list.
  2. Configuration:
    • Set the base RSI parameters (length, price source like close).
    • Choose the MTF timeframe—e.g., apply a 60-minute divergence to a 5-minute chart for intraday trading.
    • Enable alerts: Configure sound, email, or popup notifications for new divergences.
    • Customize visuals: Adjust arrow sizes, colors, and whether to draw connecting lines between price and RSI peaks/troughs.
  3. Interpreting Signals:
    • Bullish Regular Divergence: Look for a green upward arrow or 'B' label under a price low where RSI shows a higher low. This suggests a potential reversal from downtrend to uptrend—enter long positions after confirmation (e.g., price breaking above a recent high).
    • Bearish Regular Divergence: Red downward arrow or 'S' above a price high with RSI lower high. Ideal for short entries in fading uptrends.
    • Hidden Divergence: Use for trend continuation—e.g., bullish hidden (higher price low, lower RSI low) during pullbacks in uptrends to add to longs.
    • MTF Overlay: On a 5-minute chart, a 30-minute divergence signal appears as a thicker line or distinct marker, indicating alignment with the larger trend. Only trade in the direction of the higher timeframe for higher probability.
  4. Practical Usage Strategies:
    • Reversal Trading: Combine with support/resistance levels. For instance, a bullish regular divergence at a key support zone on the daily MTF could signal a strong buy.
    • Trend Confirmation: In a strong uptrend, ignore bearish divergences unless confirmed by multiple timeframes; focus on bullish hidden for entries on dips.
    • Scanning and Watchlists: Use the indicator's plots in a market scanner to filter stocks showing divergences across assets. For example, scan for bullish divergences on a watchlist of S&P 500 components.
    • Risk Management: Always use stop-losses below recent lows for longs (or above highs for shorts). Target profits at prior resistance or using risk-reward ratios (e.g., 1:2).
    • Confirmation with Other Tools: Pair with volume (increasing on reversal confirms signal), moving averages, or other oscillators like MACD for confluence.

Example: In a volatile stock like Tesla (TSLA) on a 15-minute chart, overlay a 1-hour MTF RSI Divergence. If price hits a new low but the 1-hour RSI shows a higher low (bullish regular), wait for a candle close above the divergence bar to enter long, targeting the next resistance.

Why the MTF RSI Divergence Indicator is Useful for Technical Analysis

In technical analysis, success hinges on identifying high-probability setups amid market noise. The MTF RSI Divergence indicator excels here for several reasons:

  1. Enhanced Signal Reliability Through MTF Confluence:
    • Single-timeframe analysis often leads to whipsaws. By incorporating higher timeframes, the indicator filters out minor divergences, focusing on those with broader market agreement. This "top-down" approach aligns short-term trades with long-term trends, improving win rates.
  2. Early Warning of Momentum Shifts:
    • Divergences often precede price reversals by several bars, giving traders an edge. The real-time, non-repainting nature ensures signals are actionable without delay, crucial in fast-moving markets like forex or futures.
  3. Versatility Across Market Conditions:
    • Works in trending or ranging markets: Regular divergences for reversals in ranges, hidden for continuations in trends. Its integration with scans and strategies makes it ideal for algorithmic trading or high-volume screening.
  4. Reduces Emotional Bias:
    • Objective signals based on mathematical discrepancies eliminate guesswork. Alerts prevent missed opportunities, while customizable parameters allow adaptation to personal trading styles.
  5. Backtesting and Strategy Building:
    • Plots compatible with backtesters (e.g.,  Strategy Builder) enable quantitative validation. Studies show divergence strategies can yield positive expectancy when combined with MTF, especially in equities and indices.

Empirical evidence from trading communities (e.g., forums ) highlights its utility: Users report fewer false signals compared to standard RSI, with MTF adding a layer of confirmation that boosts confidence.

Potential Limitations and Best Practices

While powerful, no indicator is infallible. Divergences can fail in strong trends (e.g., "divergence traps" where momentum rebuilds), so always confirm with price action. Over-optimization of parameters can lead to curve-fitting—test on out-of-sample data. In low-volatility markets, signals may be sparse.

Best practices: Use on liquid assets, combine with fundamental analysis for context, and maintain a trading journal to refine usage.

Conclusion

The MTF RSI Divergence indicator from PatternSmart is a must-have for technical analysts seeking to elevate their game. By merging the proven RSI divergence concept with multi-timeframe insights, it provides a comprehensive view of momentum dynamics, helping traders spot reversals, continuations, and high-probability entries. Whether you're a day trader scanning for intraday setups or a swing trader aligning with daily trends, this tool's real-time accuracy, customization, and integration capabilities make it invaluable. Incorporate it into your arsenal, and watch how it transforms your analysis from reactive to proactive in the ever-evolving markets of 2026 and beyond.


Get it now: MTF(Multi Time Frame) RSI Divergence indicator, scan, watchlist(custom quotes) for Thinkorswim TOS 


Tuesday, June 26, 2018

How to use Ninjatrader 8 CHART PATTERN indicator as scan filter in Market Analyzer Column MAC


All of our Ninjatrader 8 CHART PATTERN indicator can be used as scan filter in Market Analyzer.

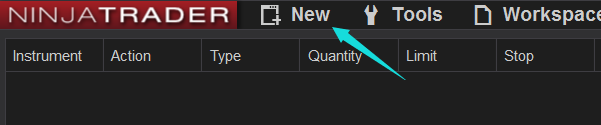
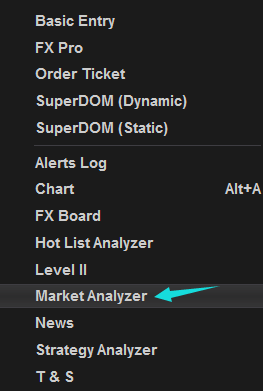
You can access the Market Analyzer window from within the NinjaTrader Control Center window by left mouse clicking on the menu New, and then selecting the menu item Market Analyzer.


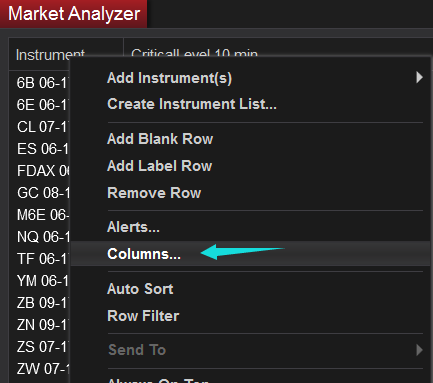
After you open the Market Analyzer window, right click and select 'columns'.


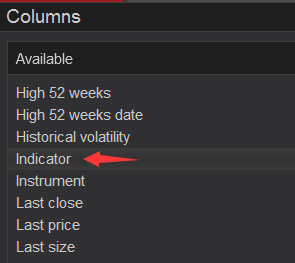
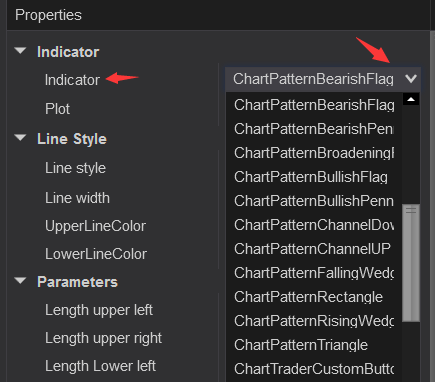
You will see all available columns now, go to 'Indicator'.


Select the chart pattern you want to use:


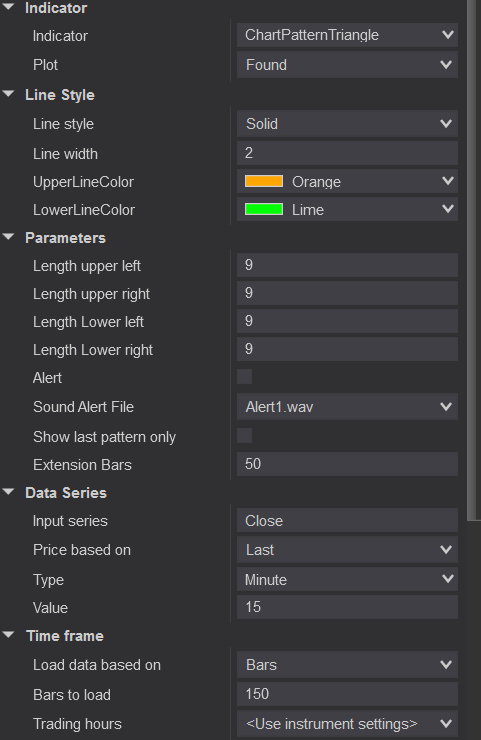
After you select one of them you should see all of its inputs as the pic below.


Make sure you load at least or more than 150 bars. 


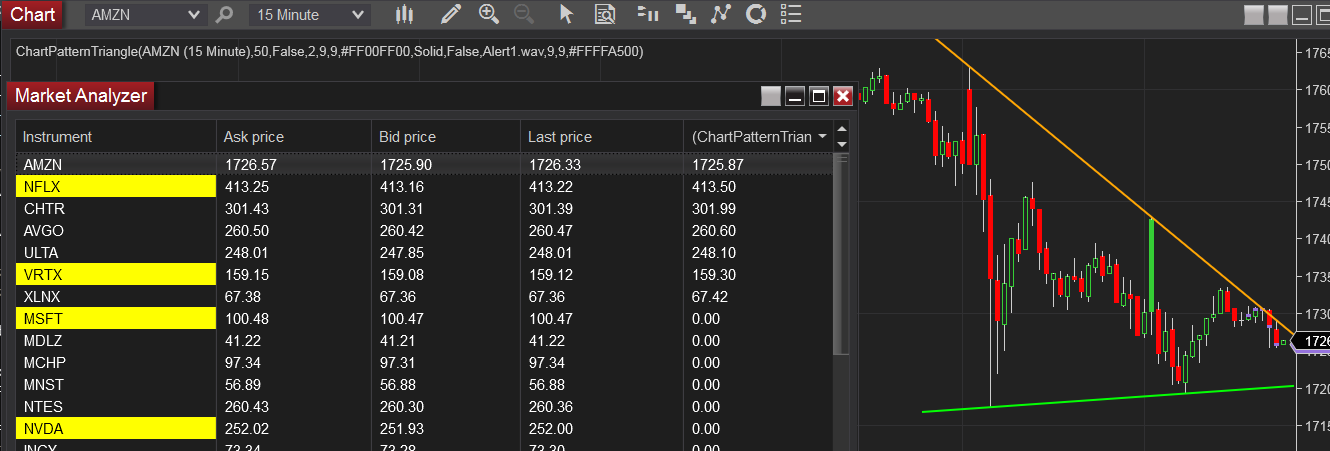
If there was a chart pattern found with your settings the column would display a value greater than 0. If there was no pattern found it would display 0.


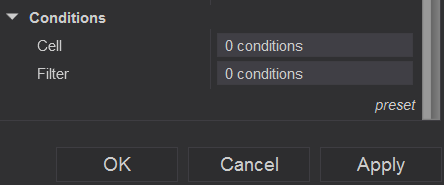
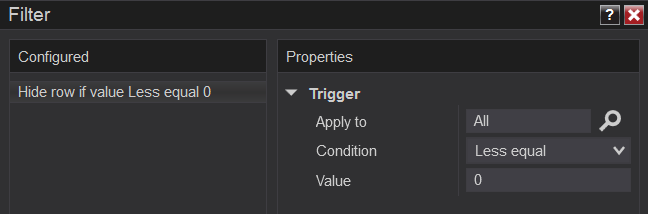
If you want to use it as a scan filter, you need to add a Filter condition(Not Cell condition).


Please use the following settings in order to filter out symbols without a pattern found.


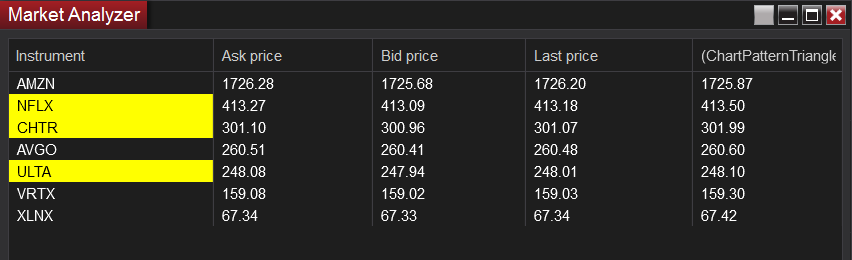
To enable/disable filtering press down on your right mouse button in the Market Analyzer window and select the menu Row Filter. When enabled, the Market Analyzer will filter out rows from the grid display based on the Filter Conditions of the columns. 

The image below is an example of a list of symbols after 'Row Filter' enabled.


Please do not add more than one filter unless you know what you are doing.

Here is a link of
How to use ninjatrader Market Analyzer

Thursday, February 16, 2017

Swing High Low indicator and screener ProRealTime


This is a custom ProRealTime indicator, it works the same way as my TOS version's Swing High Low extension indicator and proscreener.

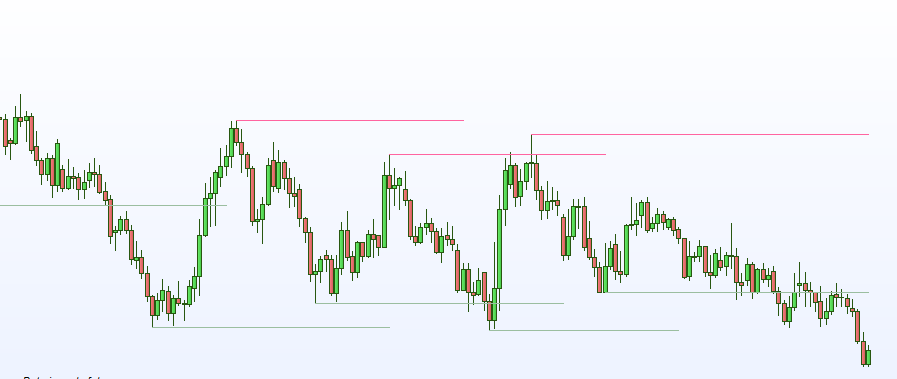
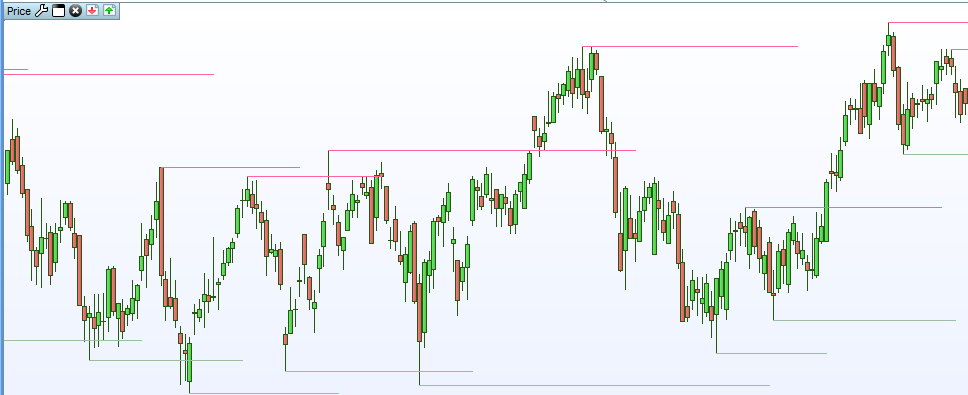
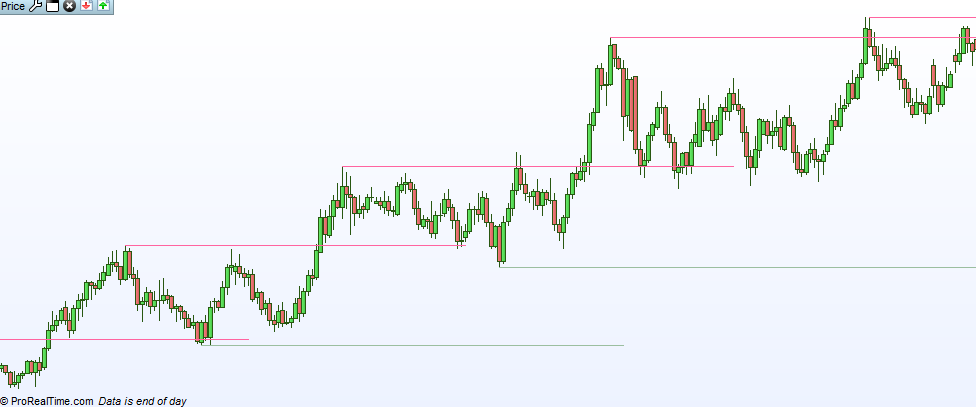
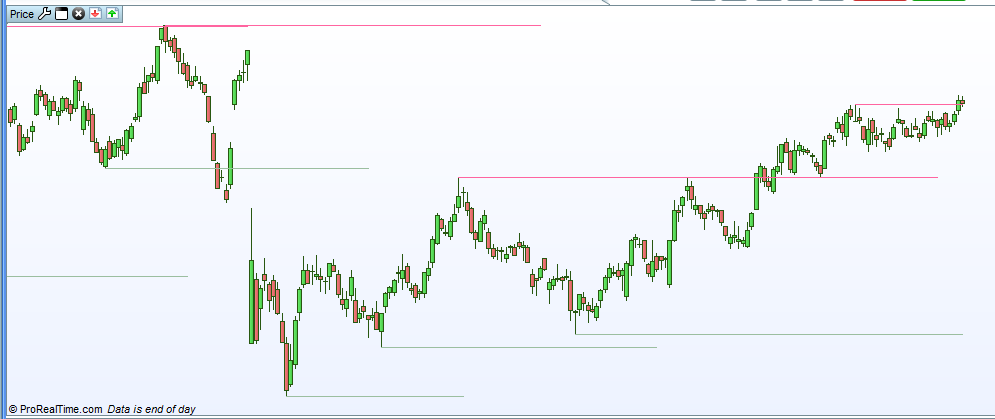
The Swing high low extension indicator will plot lines that represent the swing high low points based on the swing length input(number of bars to the left and right of the swing point).


Swing highs and lows can be used by traders to identify possible areas of support and resistance , which can then be used to determine optimal positions for stop-loss or profit target orders. If an indicator fails to create a new swing high while the price of the security does reach a new high, there is a divergence between price and indicator, which could be a signal that the trend is reversing.

Swing highs and swing lows are earlier market turning points. Hence, they are natural choices for projecting support and resistance levels. Every swing point is a potential support or resistance level. However, for effective trading, focus on major swing highs and lows.


This package includes Swing high low extension indicator and proscreener for ProRealTime. It works on any time frame(Tick, Minutes, Daily, Weekly, Monthly) and all markets(Stocks, Futures, Forex, Options,ETF, etc.)


The default SCAN will search any symbol that the Close cross below the swing low or cross above the swing high.

Please follow the steps below to import the indicator and proscreener:

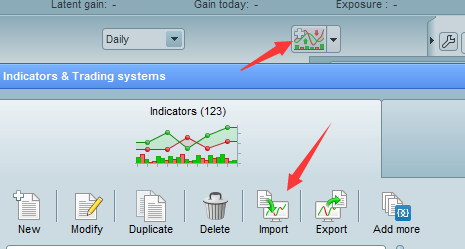
Import all files that I sent to you.


After import the indicator, you will be able to add it to chart.

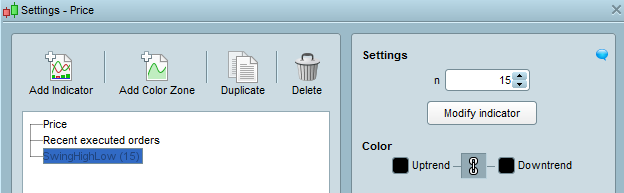
The input n represents the number of bars to the left and right of the swing point.

Please note: only the file SwingHighLow is for indicator.

SwingHigh-SCAN and SwingLow-SCAN are for ProScreener only, please do not load them on chart.


Here is how to create the screener:

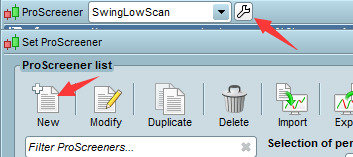
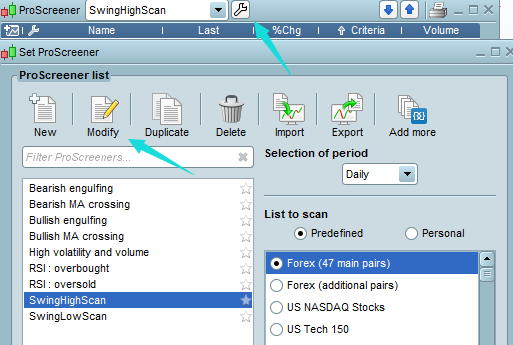
1. find Proscreener tab, and click the icon shown in below

2. click 'New' button then copy & paste the code(in .txt file) I sent to you.

3. change it to your preferred name.


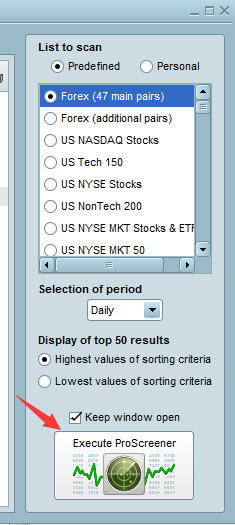
4. select a list to scan and click 'Execute' button.

5. repeat the steps 1-4 for both swing high and low scans.


Once the New screener is created, you can change the input n by clicking on 'Modify' the screener file as shown below


The default setting of the ProScreener is to scan if the price close above or below the current swing high or low.
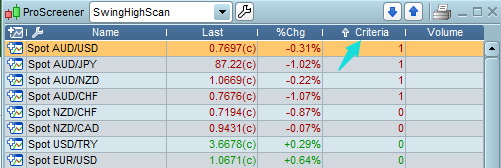
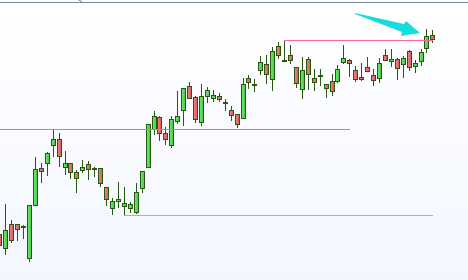
The picture below is an example of price close above the current swing high, you will get 'Criteria'=1 in ProScreener when you execute swing high scan.


The swing ProScreener can also be customized to meet your needs.

Please send me the details if you want a different screener.


Monday, November 7, 2016

RSI divergence indicator special edition for Thinkorswim TOS

RSI divergence indicator package include:
  1. RSI divergence indicator special edition
    • The special edition contains two parts: a main chart and a lower chart with normal RSI plot. Both charts come with arrows to point out an occurrence of a divergence.
  2. RSI divergence special edition SCAN
    • This customized scanner will find all Positive/Negative (bearish/bullish) RSI Divergence based on your settings.
  3. RSI divergence special edition custom quote(watchlist column)
    • This custom quote will help you to quickly identify the RSI Divergence signals in the Watchlist. It will detect all Positive/Negative (bearish/bullish) RSI Divergence based on your settings.

Sometimes, there are too many divergence signals, and that is not a good thing for traders.  Hence, we developed this special edition package to help you pinpoint the most valuable signals.

Unlike the regular divergence indicator, this special edition used a unique algorithm to filter out some noises(minor divergence). You may only see one signal in six month on a daily chart.


You can get this indicator package at: RSI divergence indicator special edition for Thinkorswim TOS


Wednesday, January 13, 2016

How to add/setup custom scan in Thinkorswim TOS


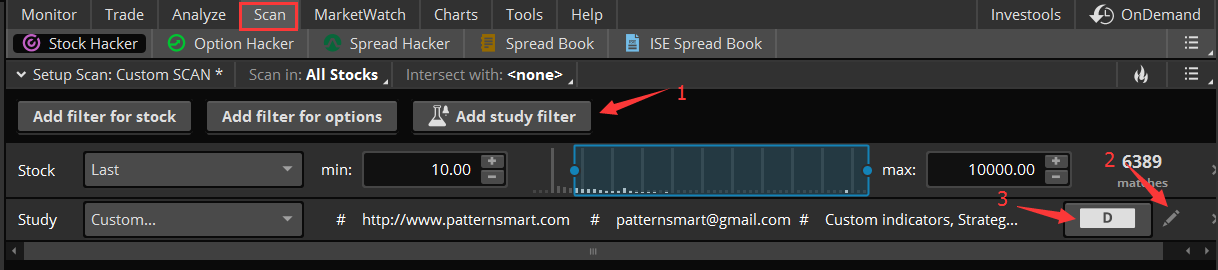
1. Click the "Scan" tab and choose "Stock Hacker" from the sub-tab row.

2. Click "Add Study Filter" (arrow 1) and then click "edit" button (arrow 2) 


3. Click "thinkScript Editor" then empty the textfield.
4. Copy and pasty all the code from the file that I sent to you then Press OK.

 5. Save the SCAN 


Please note: in Scan, every time-frame is a single unit. So there will be no 5D:5m, or 20D:1h.
If you want to use 1 hour time-frame, just choose 1h.
The following image shows all available time-frame in Scan.


Sometimes you will get "no results" during the TOS maintenance period, that's very common.
Please try the scan after the maintenance.


Wednesday, September 16, 2015

Super Trend indicator, SCAN, screener Bundle for Thinkorswim TOS
 GET IT:http://www.patternsmart.com/cart/index.php?route=product/product&product_id=304&search=super

SuperTrend Indicator bundle includes:

Super Trend indicator CUSTOM Scan (Stock Hacker) Thinkorswim TOS
Multi Time Frame(MTF) SuperTrend indicator screener, market radar, custom quotes system for TOS (thinkorswim)
Super Trend indicator advanced edition Thinkorswim version

The file will be sent to your email after the payment is cleared.

Super Trend indicator CUSTOM Scan (Stock Hacker) Thinkorswim TOS

VIP price is: $69

http://www.patternsmart.com/cart/index.php?route=product/product&product_id=302&search=super

SuperTrend Indicator is good to identify the trend of current market.
It uses Average True Range (ATR) and median price to calculate the upper and lower trend line.
It provides signals whenever the price breakout the current trend line.

Feature:

  • Search for symbols in up trend or down trend within given bars.
  • Scan in any symbol set, such as stocks, futures, FX, indices, funds.
  • With many price conditions: price range, volume range, etc.
  • Intersecting with your other preferred indicators: RSI, MACD, Moving average, ATR, ADX, Bollinger, MoneyFlow, Williams, etc.
  • Scan in any time frame, 5mins, 15mins, 30mins, 1 day, 1 week, 1 month.

You can combine any criteria you want to make your own custom scanner.
For example, scan in daily time frame with any "optionable" symbol from $50 to $100 with volume greater than 500k, and today's the 2nd bar from the start of up trend.
Example 2, scan in 30 min time frame with any symbol that the current bar is the 3rd bar from the start of down trend.
Example 3, scan all FX in 1 hour time frame with RSI is below 30 and current bar is the 1st bar of down trend or up trend.

Please contact us if you need our help to build a complex custom scanner.
Note:Super Trend indicator sold separately.
The file will be sent to your email after the payment is cleared.

Tuesday, June 23, 2015

Advanced CCI Divergence SCAN for Thinkorswim TOS


Advanced CCI Divergence SCAN for Thinkorswim TOS

This customized scanner will find all Positive/Negative (bearish/bullish) CCI Divergence based on your settings.
The algorithm of this SCAN is same as our CCI Divergence indicator.

This Advanced scanner is specially made for experienced traders.
For example, you can search CCI Divergence signals in a short range, such as 15 bars(applicable to any time period).
You can also search in a long range, such as 60 or 100 bars. Furthermore, you can specify the percentage of price change between 2 Highs and the percentage of CCI value change which are used to find the Divergence.
It makes possible to scan on very complex conditions.
Example 1, scan Negative (bearish) CCI Divergence if current High is the peak within 15 bars, and it's 5% greater than the peak from 25 bars ago. At the same time, the current CCI value is 8% less than the CCI value of that peak from 25 bars ago.
Example 2, scan Positive (bullish) CCI Divergence if current Low is the trough within 5 bars, and it's 3% less than the trough from 15 bars ago. At the same time, the current CCI value is 10% greater than the CCI value of that trough from 15 bars ago.

Features:
  • You can change all CCI (Commodity Channel Index) parameters:
    • length: The number of bars used to calculate the CCI.
    • price: The price used to calculate the CCI.
    • average type: The type of moving average to be used in calculations: simple, exponential, weighted, Wilder's, or Hull.
  • Length 1&2: Define the range of bars which are used to calculate the recent High and previous High, as shown in picture.
  • Percent: The difference between High1 and High2, as shown in picture.
     
  • CCI_Percent: The difference between CCI1 and CCI2, as shown in picture.
  • Scan in many time frames, 5mins, 15mins, 30mins, 1 day, 1 week, 1 month.
  • Applicable for all securities(Stocks, Futures, Forex, Options,ETF, etc.).

Regular price: $99.
$99, $29 with purchase of our CCI Divergence indicator.